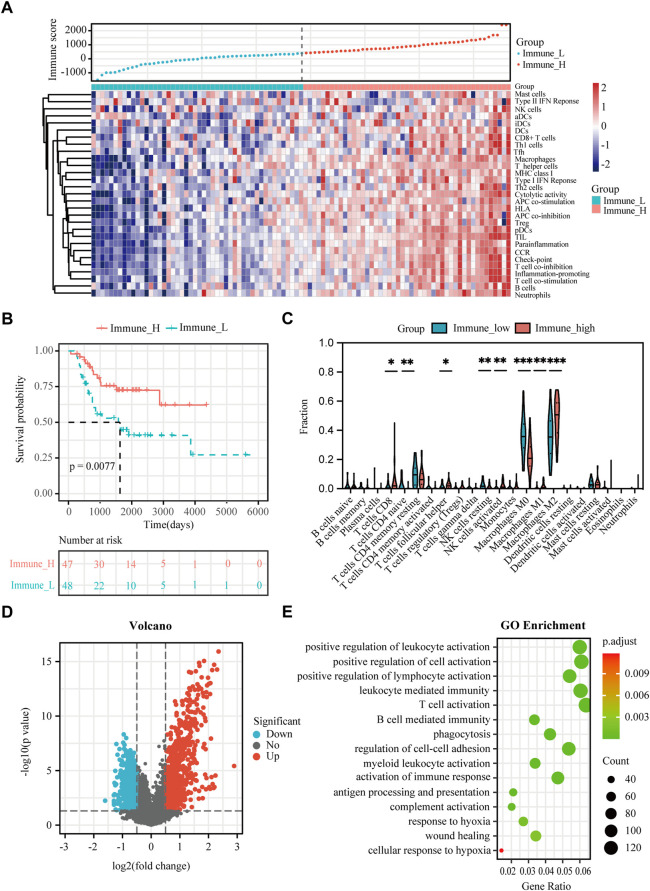
FIGURE 2.
Analysis of immune status and immune-associated DEGs in osteosarcoma. (A) Enrichment levels of 29 immune signatures in the immune-high and immune-low groups in the TARGET dataset. (B) K-M plot of overall survival for patients in immune-high and immune-low groups in the TARGET dataset. (C) Comparison of 22 infiltrating immune cells between immune-low and immune-high groups in the TARGET dataset. (D) Volcano plot showing the DEGs between immune-high and immune-low groups in the TARGET dataset. (E) GO analysis of DEGs between immune-high and immune-low groups in the TARGET dataset. Asterisks mark statistically significant difference. *p < 0.05, **p < 0.01, ***p < 0.001.

