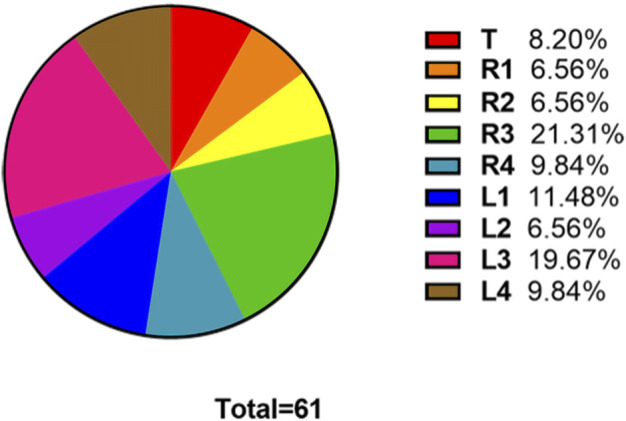
FIGURE 4.

The ratio of the number of fake crackles audio recordings at each location to the total number of fake crackles audio recordings. The figure shows that the number of fake crackles audio recordings in R3 and L3 are significantly more than that in other locations.
