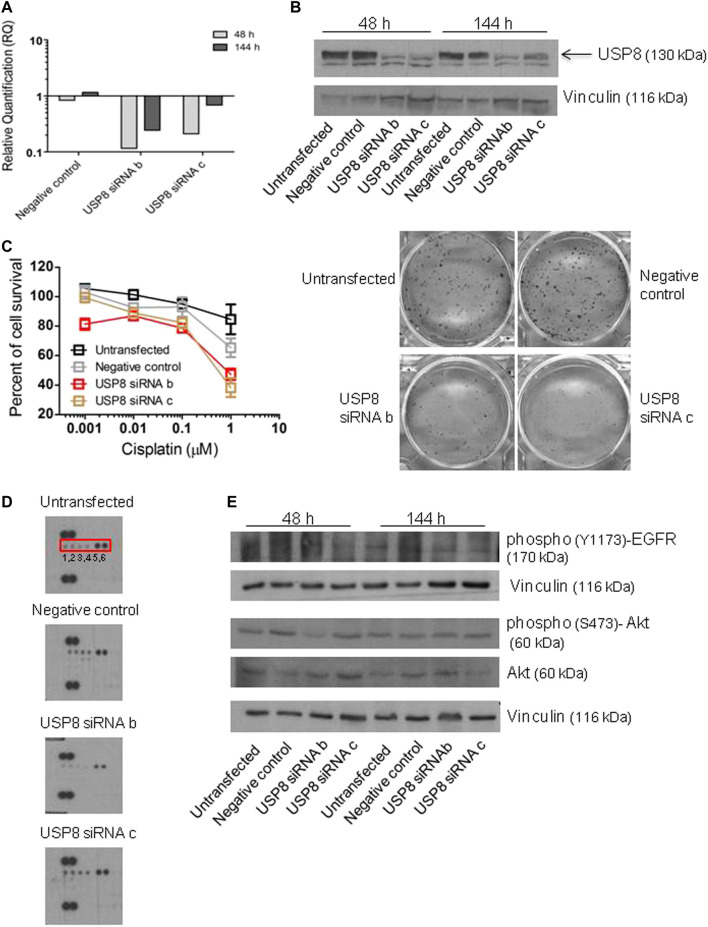
FIGURE 2.
Survival-related features of IGROV-1/Pt1 cells upon USP8 molecular targeting. (A) Quantitative RT-PCR of USP8 mRNA levels in IGROV-1/Pt1 at different time points after siRNA transfection; untransfected cells were the calibrator; GAPDH was used as housekeeping gene. (B) USP8 protein levels were analyzed by western blot at different time points after siRNA transfection. The reported experiment is representative of three. Vinculin was used as loading control. Quantification of the band intensity was performed with ImageJ, with normalization to vinculin and the obtained values are reported in Supplementary Figure S2 (C) Colony forming ability assayed 48 h after transfection start. Twenty-4 h after seeding IGROV-1/Pt1 cells were treated with cisplatin (continuous exposure). IC50 is the concentration inhibiting cell growth by 50% (IC50 > 1 µM for untransfected or negative control cells, IC50 = 0.78 and 0.52 µM for USP8 siRNAb and siRNAc cells, respectively). (p < 0.0001 by One-Way ANOVA followed by Bonferroni’s test for multiple comparisons). The reported values are the mean ± SD of three replicates. The reported experiment is representative of two. Representative images of cells treated with 1 μM cisplatin are shown. (D) Human phospho-RTK Array analysis 48 h after transfection start. Phospho-EGFR = 1,2; phospho-ErbB2 = 3,4; phospho-ErbB3 = 5,6. Quantification of dot intensity was performed using ImageJ. The obtained values are reported in Supplementary Table S1 (E). Western blot analysis of protein levels in USP8-silenced cells. Quantification of the band intensity was performed using ImageJ, with normalization to vinculin. The band intensities of phosphorylated Akt were referred to total forms. The obtained values are reported in the Supplementary Figure S2.

