Figure 4.
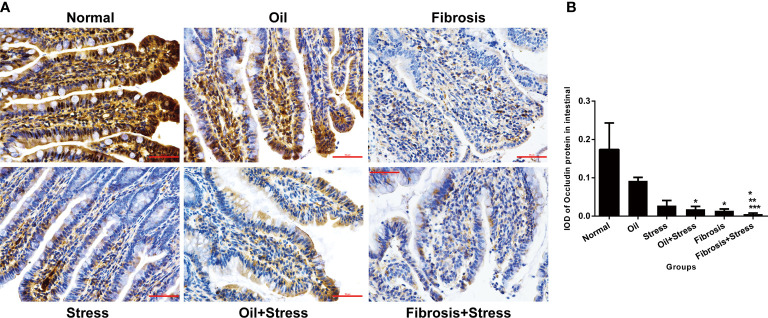
Occludin protein expression in intestinal tissue of rats. (A) Immunohistochemical staining of occludin protein in intestinal tissue. Scale bar: 50um. (B) Semi-quantitative analysis of occludin protein in intestinal tissue. Data are shown as means ± SD. *p < 0.05 vs. normal group and oil groups; **p < 0.01 vs. stress group and oil+stress groups; ***p < 0.001 vs. fibrosis group.

