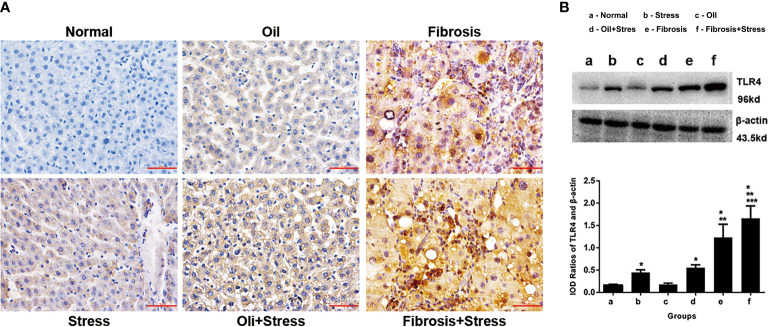
Figure 5.
TLR4 protein expression in liver tissue of rats. (A) Immunohistochemical staining of TLR4 protein in liver tissue. Scale bar: 50um. (B) Western blot and quantitative analysis of TLR4 protein in liver tissue. (up) The typical image of TLR4 protein expression. (down) Quantification of TLR4 protein expression (IOD). Data are shown as means ± SD. *p < 0.05 vs. normal group and oil groups; **p < 0.01 vs. stress group and oil+stree groups; ***p < 0.001 vs. fibrosis group. TLR4, toll-like receptor 4; IOD, integral optical density.

