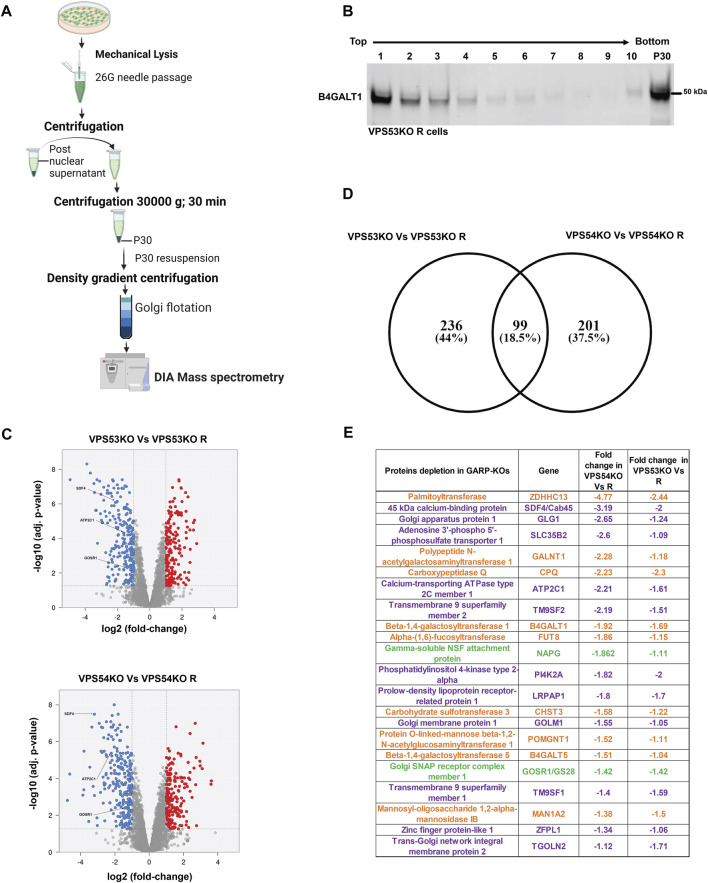
FIGURE 2.
Quantitative Mass spectrometry (MS) analysis of Golgi-enriched membranes isolated from GARP-KOs revealed depletion of multiple Golgi proteins. (A) Schematic of the major steps during preparation of Golgi samples for MS analysis. Schematic was made in BioRender. (B) WB for Golgi marker B4GALT1 in membranes isolated from VPS53KO R cells and separated by the Nycodenz flotation gradient. (C) Volcano plot analysis of relative protein abundance in VPS53KO and VPS53KO R (Top) and VPS54KO and its VPS54KO R cells (Bottom). Blue circles represent the proteins significantly depleted in GARP-KO cells. Red circles represent proteins significantly increased in GARP-KO cells. Gray circles are proteins with no significant differences. (D) Venn diagram demonstrating common proteins depleted in both VPS53KO and VPS54KO cells. (E) List of Golgi proteins significantly depleted in both VPS53KO and VPS54KO cells. Proteins with color orange are Golgi enzymes, purple are Golgi resident proteins, and Green are Golgi SNAREs.

