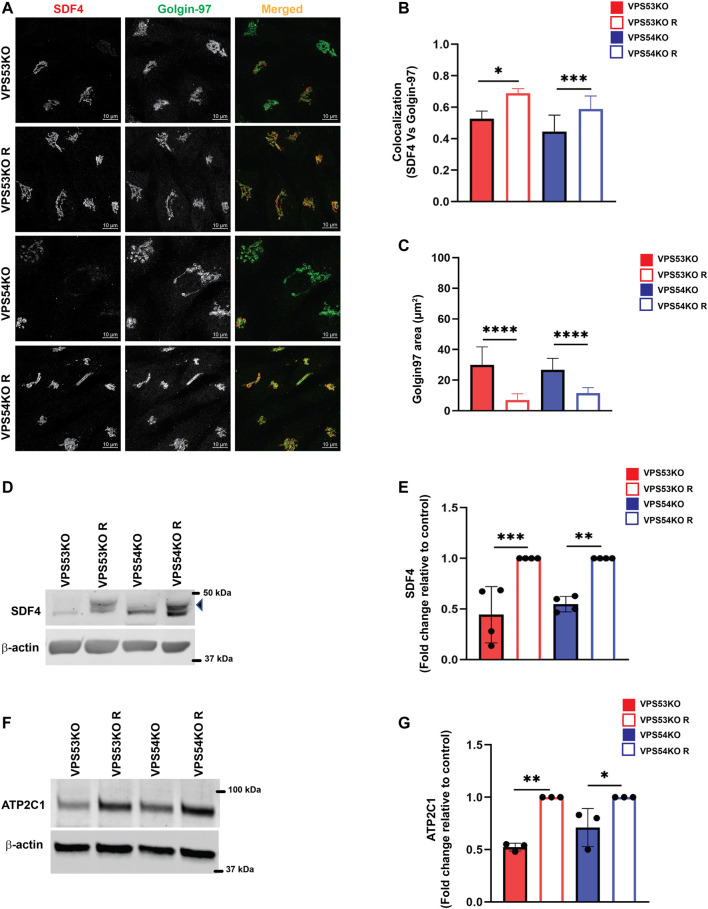
FIGURE 3.
GARP dysfunction alters cellular expression of Ca2+ binding SDF4/Cab-45 and Ca2+-transporting ATP2C1/SPCA1 Golgi proteins. (A) Airyscan microscopy of VPS53KO, VPS53KO R, VPS54KO and VPS54KO R cells co-stained for SDF4 and Golgin97. (B) The graph shows the quantification of SDF4 and Golgin97 colocalization using Pearson’s correlation coefficient. Values in the bar graph represent the mean ± SD from the colocalization between SDF4 and Golgin97 from 50 different cells. (C) Quantification of Golgin97 area. n = 30 cells per group. (D) WB analysis of SDF4 in GARP-KO and rescued cells. The arrowhead pointing to SDF4 is the specific band. (E) Quantification of SDF4 WBs from four independent experiments. (F) WB analysis of ATP2C1 in GARP-KO and rescued cells. (G) Quantification of ATP2C1 blots from three independent experiments. β-actin was used as the internal loading control. Values in bar graph represent the mean ± SD from at least three independent experiments. Statistical significance was calculated using one-way ANOVA. *** p ≤ 0.001, ** p ≤ 0.01, * p ≤ 0.05.

