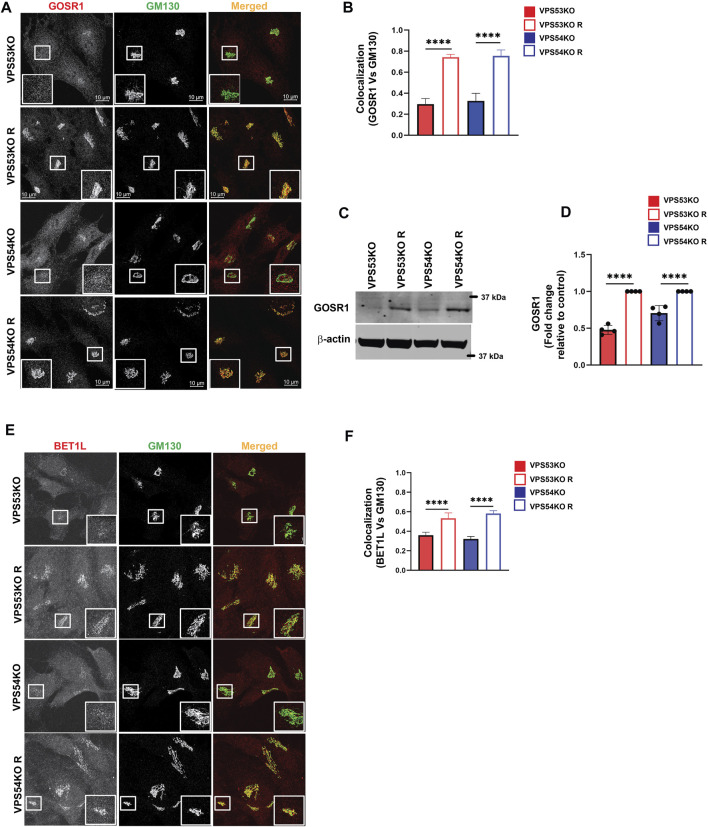
FIGURE 4.
GARP-KO alters localization and expression of intra-Golgi v-SNAREs GOSR1 and BET1L. (A) Airyscan microscopy of GARP-KOs and control cells co-stained for GOSR1 and GM130. The large white square box inside the image is the zoomed view of the small square box (2X inset). (B) The graph shows the quantification of GOSR1 and GM130 colocalization. Values in the bar graph represent the mean ± SD from the colocalization between GOSR1 and GM130 from 40 different cells. (C) WB analysis of GOSR1 protein level in VPS53KO, VPS54KO, and their controls. β-actin was used as internal loading control. (D) Quantification of the blots from four independent experiments. (E) Airyscan imaging of VPS53KO, VPS53KO R, VPS54KO, VPS54KO R cells co-stained for BET1L and GM130. The large white square box inside the image is the zoomed view of the small square box (2X inset). (F) Colocalization analysis between BET1L and GM130 using Pearson’s correlation coefficient. n = 40 cells were imaged per group for the quantification. Statistical significance was calculated using one-way ANOVA. **** p ≤ 0.0001.

