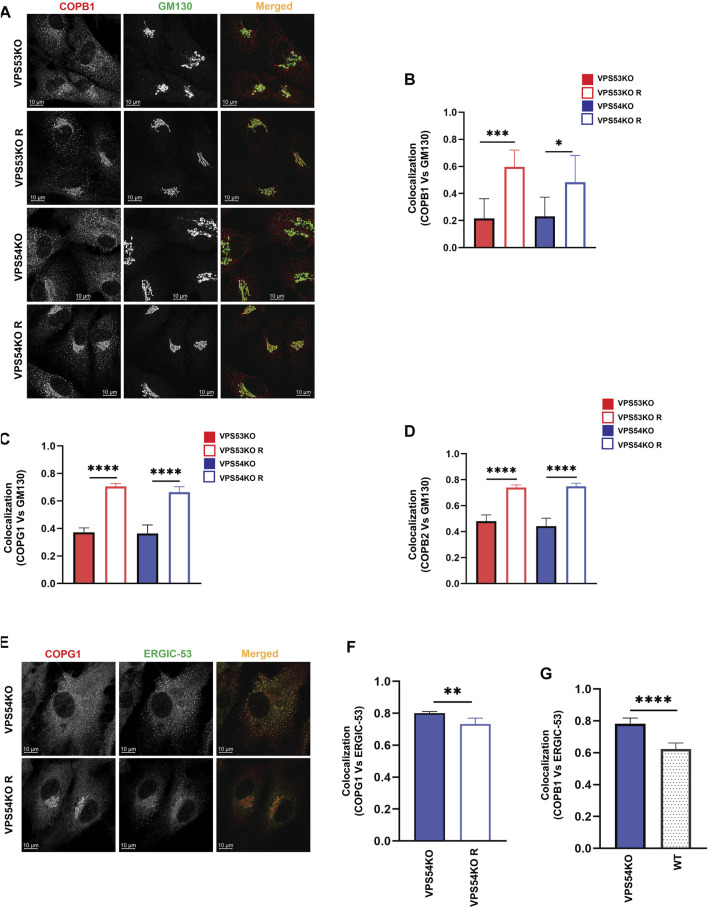
FIGURE 6.
COPI subunits are displaced from the Golgi in GARP-KO cells. (A) Airyscan microscopy of GARP-KO cells and control cells stained with antibody to coatomer subunit COPB1. Colocalization analysis of COPB1 and GM130 (B), COPG1 and GM130 (C), COPB2 and GM130 (D) using Pearson’s correlation coefficient. n = 40 cells used for colocalization analysis per group. (E) Airyscan microscopy of COPG1 and ERGIC-53 in VPS54KO and VPS54KO R cells. (F) Colocalization analysis of COPG1 and ERGIC-53 and (G) COPB1 and ERGIC-53 using Pearson’s correlation coefficient. n = 40 cells used for colocalization analysis. Statistical significance was calculated using one-way ANOVA. **** p ≤ 0.0001, ** p ≤ 0.01.

