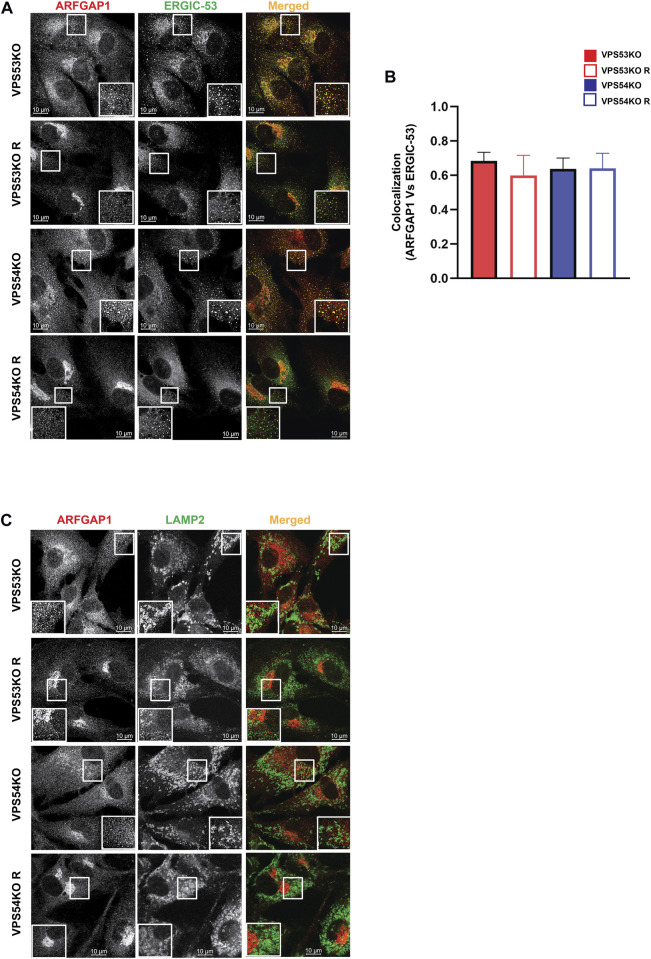
FIGURE 8.
GARP depletion does not affect ARFGAP1 localization to ERGIC. (A) Airyscan microscopy of GARP-KO and control cells co-stained for ARFGAP1 and ERGIC-53. The large white square box inside the image is the zoomed view of the small square box (2X inset). (B) Colocalization analysis of ARFGAP1 and ERGIC-53 using Pearson’s correlation coefficient. (C) Airyscan microscopy of GARP-KO and control cells stained for ARFGAP1 and LAMP2. The large white square box inside the image is the zoomed view of the small square box (2X inset).

