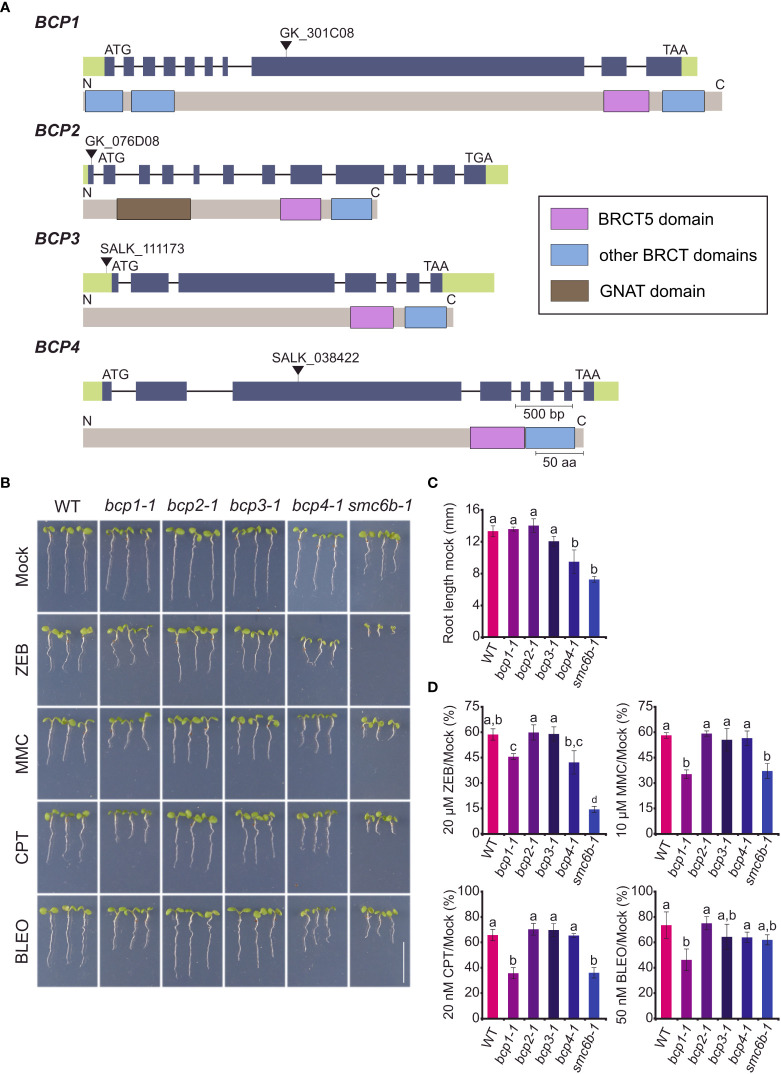
Figure 2.
Phenotypes of mutants in uncharacterized Arabidopsis BRCT5 domain-containing genes. (A) Gene and protein structures of the BRCT5 CONTAINING PROTEINS (BCPs). The positions of T-DNAs in the used mutant alleles are indicated by black triangles above the gene models. Introns are indicated by a horizontal line and exons by green (untranslated regions) and purple (coding sequence) colors. Protein models under gene models (grey) show the position of known domains: BRCT - blue rectangles and GNAT (Gcn5-related N-acetyltransferase) - brown rectangle. (B) Representative phenotypes of seven days old wild-type (WT) and homozygous mutant plants grown on media containing 20 μM zebularine (ZEB), 10 μM mitomycin C (MMC), 20 nM camptothecin (CPT), 50nM nM bleocin (BLEO). The smc6b-1 served as a sensitive control. Scale bar = 1 cm. (C) Root length of WT and mutant plants under control (mock) conditions. Error bars indicate the standard deviation between the means of three biological replicates. The letters above columns indicate similarities between samples. The same letters indicate samples that were not significantly different in one-way ANOVA with post hoc Tukey’s test (P < 0.05). (D) Root length of WT and mutants from B under DNA damaging treatments relative to the growth of the same genotype under mock conditions. Error bars represent the standard deviation between three biological replicates, each with at least 15 plants. Statistics were performed as in (C).

