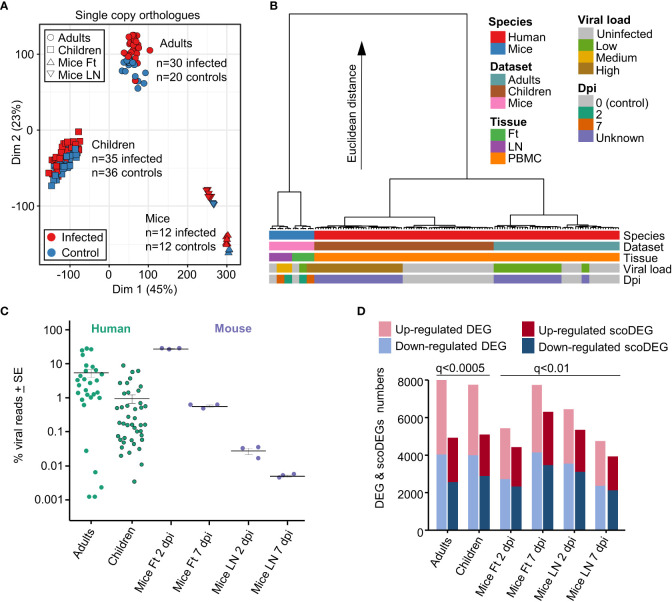
Figure 1.
Principal component and hierarchical cluster analyses, viral loads, DEGs and scoDEGs. (A) Principal component analysis (PCA) plot (PC1 - Dim1, PC2 - Dim2) for all accessions using all single copy orthologues. (B) Hierarchical cluster analysis using log2 TMM-normalized read counts of the top 500 single copy orthologues ranked by PC1 and PC2 loadings. (C) The number of viral reads in each accession expressed as a percentage of the total number of reads aligning to protein coding genes in the human or mouse genome in the same sample. Cross-bars represent the mean for each group. (D) Histogram showing the number of DEGs and scoDEGs for each group after application of the indicated significance cutoffs (q, FDR).

