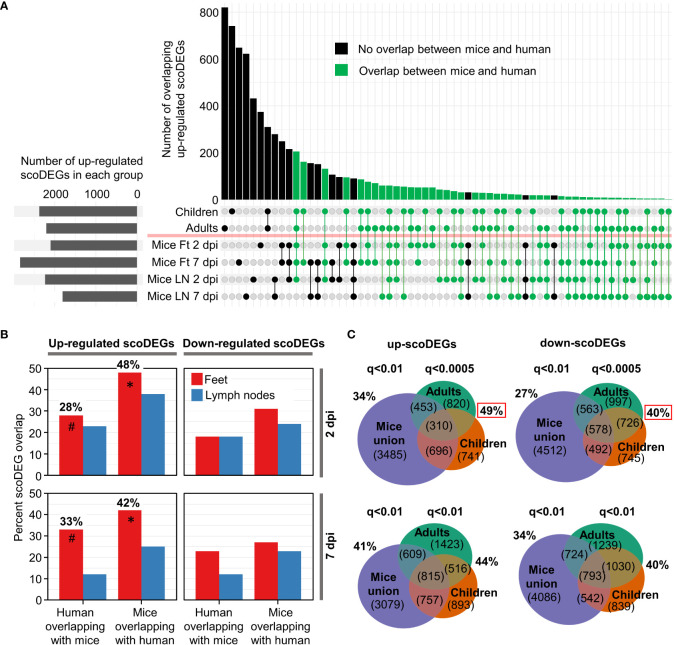
Figure 2.
ScoDEG overlaps. (A) Upset plot of overlaps of upregulated scoDEGs (from Figure 1D ). The overlap between the union scoDEGs (scoDEGs from all mouse groups) and human adults and children. (B) The percent overlap between scoDEGs for all groups. Corresponding Euler diagrams in Figure S4 . * Highest overlaps, percent of up-regulated scoDEGs identified in Mice Ft 2 and 7 dpi that were also identified in human groups. # For the same groups, but the percentage of up-regulated scoDEGs identified in humans that were also identified in Mice Ft 2 and 7 dpi. (C) Top two Euler diagrams; scoDEG overlaps using the FDR (q) cutoffs described in Figure 1D , but where all scoDEGs from all mouse groups are concatenated (union scoDEGs). Red boxes; overlap of scoDEGs identified in humans that were also identified in any mouse group. Bottom two Euler diagrams; same as above except using a cutoff of q<0.01 for scoDEG list generation for all groups.

