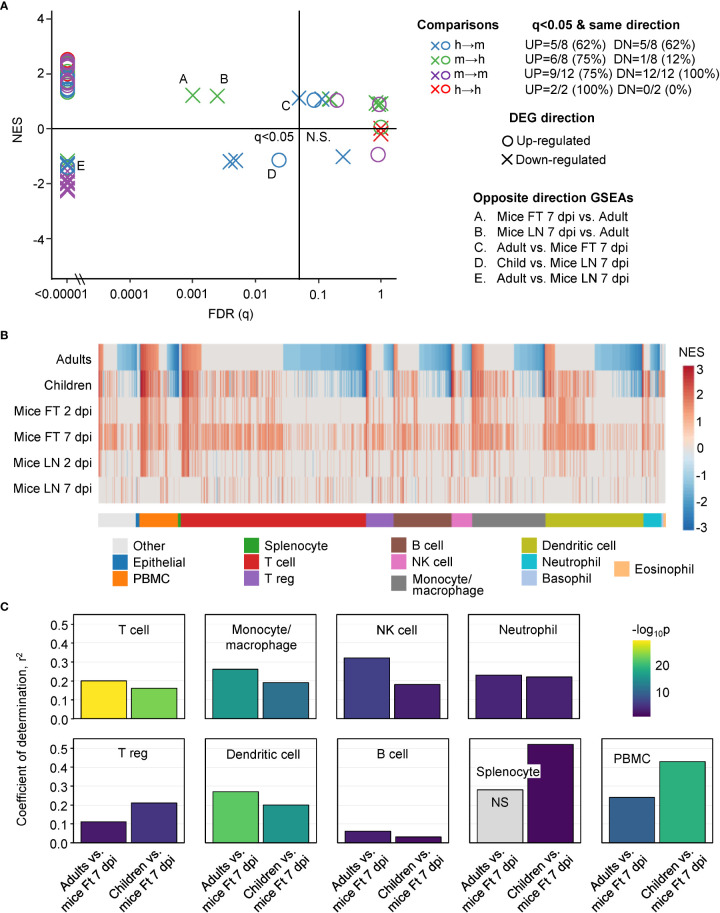
Figure 3.
GSEAs between groups and using ImmuneSigDB gene sets. (A) Reciprocal GSEAs using genes lists ranked by fold change and up- and down-regulated DEG lists from each group. Most GSEAs were significant (left of q=0.05 line), with the number of significant GSEAs over the number of GSEAs provided top right (q<0.05 & same direction). Five GSEAs gave opposite direction; e.g. up-regulated orthoDEG sets significantly enriched in the down-regulated ranked gene list (Opposite direction GSEAs). (B) GSEAs using up-regulated gene sets from ImmuneSigDB and gene lists ranked by fold change for all the groups. GSEAs significant in at least one group are segregated by cell type (mentioned in the ImmuneSigDB annotation) and ranked by Adults. Blue represents up-regulated ImmuneSigDB gene sets that are enriched in the down-regulated genes in the ranked gene lists. (C) For the GSEAs shown in b, NES for Adults vs. Ft 7 dpi and Children vs. Ft 7 dpi were plotted for the indicated cell types and Pearson correlation coefficients and significance values obtained.

