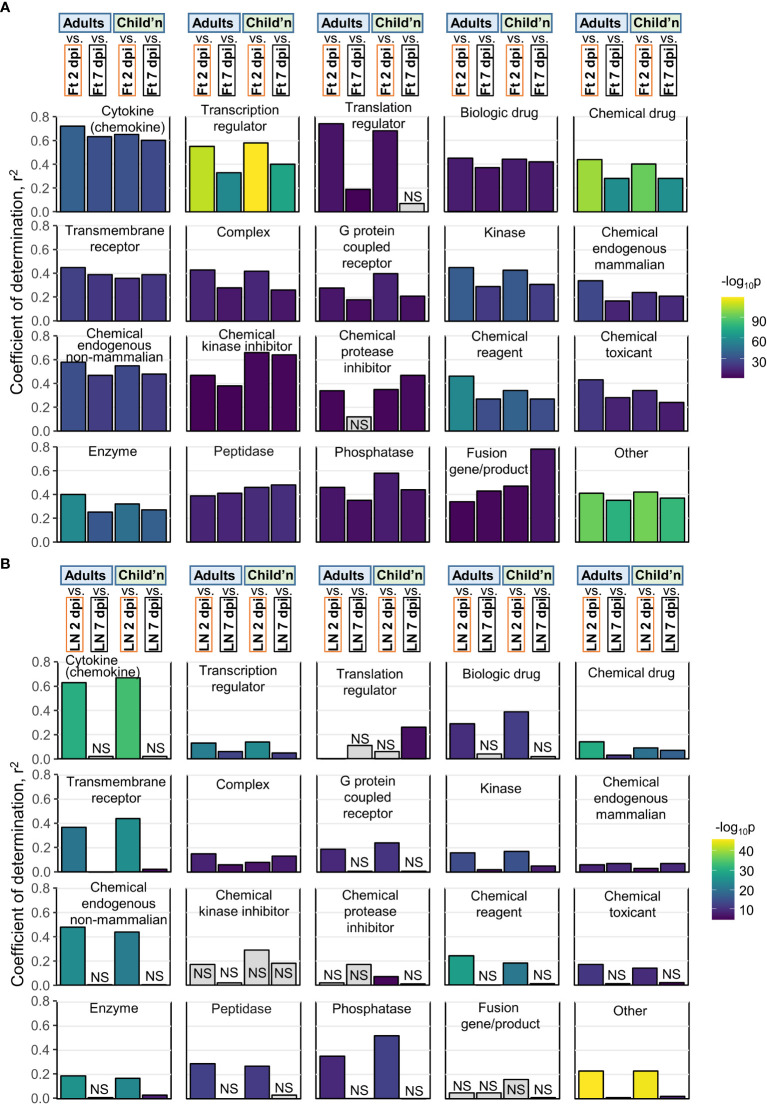
Figure 5.
Pearson correlations for IPA USRs. (A) The DEGs from Adults, Children, mice Ft 2 dpi, and mice Ft 7 dpi were analyzed by IPA to provide z-scores for significant USRs (p<0.05). The USRs were then grouped by Molecule type and Pearson correlations undertaken. For example, top left, Cytokine, compares Adults Cytokine USR z-scores with mice feet 2 dpi and 7 dpi Cytokine USR z-scores (correlation plot shown in Figure S6A ). (B) As for a, but correlations with mice LN 2 and 7 dpi.

