Figure 3.
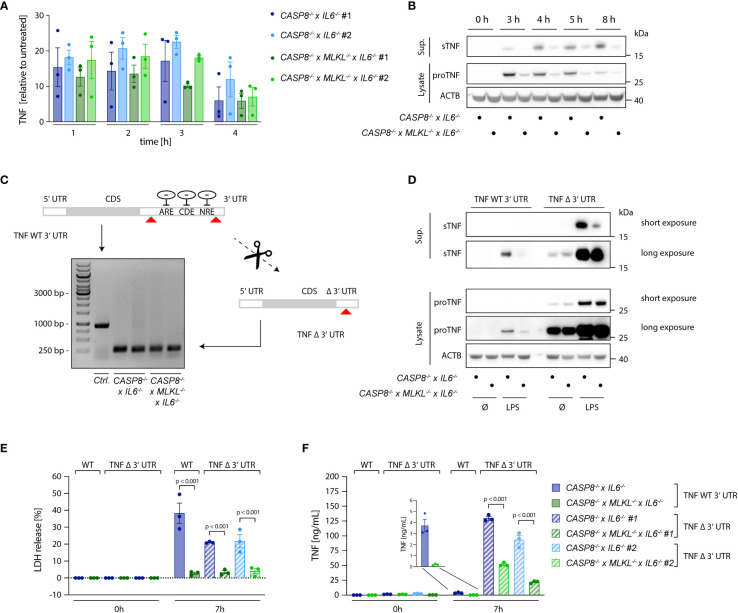
Necroptosis boosts TNF translation. (A) qPCR of TNF induced upon stimulation with 2 ng/ml LPS in the indicated cells. Results are shown as fold change relative to unstimulated cells. (B) Immunoblotting of pro-TNF (cell lysates) and sTNF (supernatants) of CASP8 -/- x IL6 -/- and CASP8 -/- x MLKL -/- x IL6 -/- cells upon stimulation with 2 ng/ml LPS for the indicated time points. ACTB was detected as loading control. (C) CASP8 -/- and CASP8 -/- x MLKL -/- BLaER1 cells deficient for the 3’UTR of the TNF gene (TNF Δ 3’UTR) were generated by employing two gRNAs targeting the 3’UTR at its very beginning and very end, respectively (red arrows). The removal of the 3’UTR was assessed by PCR (Control = long PCR product, TNF Δ 3’UTR = short PCR product). Two clones of TNF Δ 3’UTR are shown per parental genotype. (D) BLaER1 cells of the indicated genotypes were stimulated with LPS (2 ng/ml) for 7 h pro-TNF expression and matured TNF were assessed by immunoblotting. (E, F) BLaER1 cells of the indicated genotypes were stimulated with LPS (2 ng/ml) for 7 h. Cell death was evaluated by LDH assay (E). Secreted TNF was measured by ELISA (F). Data are depicted as mean ± SEM of three independent experiments or as one representative immunoblot of three independent experiments (B, D). Statistics indicate significance by two-way ANOVA with a Tukey correction for multiple testing (E, F), whereas p values are as indicated. Statistics for data in (A) were calculated using a repeated measures two-way ANOVA, whereas none of the comparisons reached statistical significance (not depicted).

