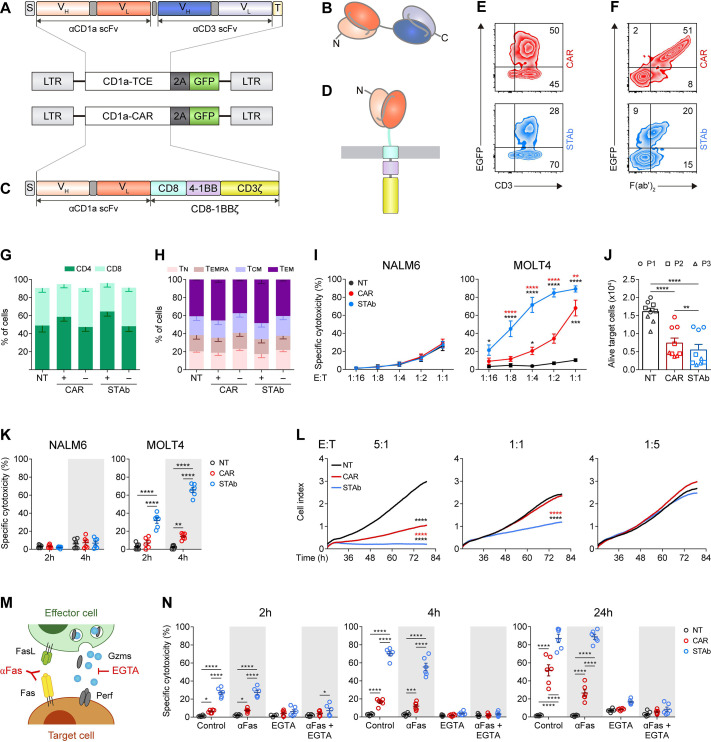
Figure 1.
Comparative in vitro study of engineered CD1a-STAb and CD1a-CAR T cells. (A, B) Schematic diagrams showing the genetic (A) and domain structure (B) of the CD1a-TCE bearing a signal peptide from the human κ light chain signal peptide (S, gray box), the anti-CD1a scFv gene (orange boxes), the anti-CD3 scFv gene (blue boxes), and the Myc and his tags (light yellow box). (C, D) Schematic diagrams showing the genetic (C) and domain structure (D) of the CD1a-CAR bearing the CD8a signal peptide (S, gray box), the anti-CD1a scFv gene (orange boxes), followed by the human CD8 transmembrane domain and the human 4-1BB and CD3ζ endodomains. CD1a-TCE and CD1a-CAR constructs were cloned into a pCCL lentiviral-based backbone containing a T2A-enhanced green fluorescent protein (GFP) cassette (A, C). (E, F) Percentage of reporter GFP (E) and F(ab')2 (F) expression in CD1a-CAR and CD1a-STAb T cells. One representative transduction out of four independent transductions performed is shown. Numbers represent the percentage of cells staining positive for the indicated marker. (G, H) Percentages of CD4+ and CD8+ T cells (G) and percentages of naïve (TN), effector memory re-expressing CD45RA (TEMRA), central memory (TCM), and effector (TEM) T cells (H) among non-transduced (NT), or CD1a-CAR and CD1a-STAb transduced T cells. (I) Specific cytotoxicity of NT, CD1a-CAR or CD1a-STAb T cells toward CD1a negative (NALM6) or CD1a positive (MOLT4) cells at the indicated E:T ratios after 24 hours. (J) Alive primary cells from three different coT-ALL patients (P1, P2, P3) after 24 hours co-culture at a 1:1 E:T ratio with NT, CD1a-CAR or CD1a-STAb T cells. (K) Specific cytotoxicity of NT, CD1a-CAR or CD1a-STAb T cells toward NALM6 or MOLT4 cells at 1:4 E:T ratio after 2 and 4 hours. (L) Real-time cell cytotoxicity assay with HEK293TCD1a target cells co-cultured with NT, CD1a-CAR or CD1a-STAb T cells at the indicated E:T ratios. Cell index values were determined every 15 min for 80 hours using an impedance-based method. Data from (G–L) is shown as mean±SEM of at least three independent experiments by triplicates (n=9). (M) Cartoon depicting target cell death induction by FasL and perforin/granzymes, and how these pathways can be blocked using anti-Fas mAb or EGTA, respectively. (N) Cytotoxicity of MOLT4 cells at 2 and 4 hours (E:T ratio 1:1) and at 24 hours (E:T ratio 1:4) in the presence or absence of anti-Fas mAb or EGTA. Plots show mean±SEM of two independent experiments with triplicates (n=6). Statistical significance was calculated by one-way (L) or two-way (G–K, N) ANOVA test corrected with a Tukey’s multiple comparisons test (*p<0.05; **p<0.01; ***p<0.001, ****p<0.0001). ALL, acute lymphoblastic leukemia; ANOVA, analysis of variance; CAR, chimeric antigen receptor; E:T, effector:target; STAb, secreting T cell-redirecting antibodies.

