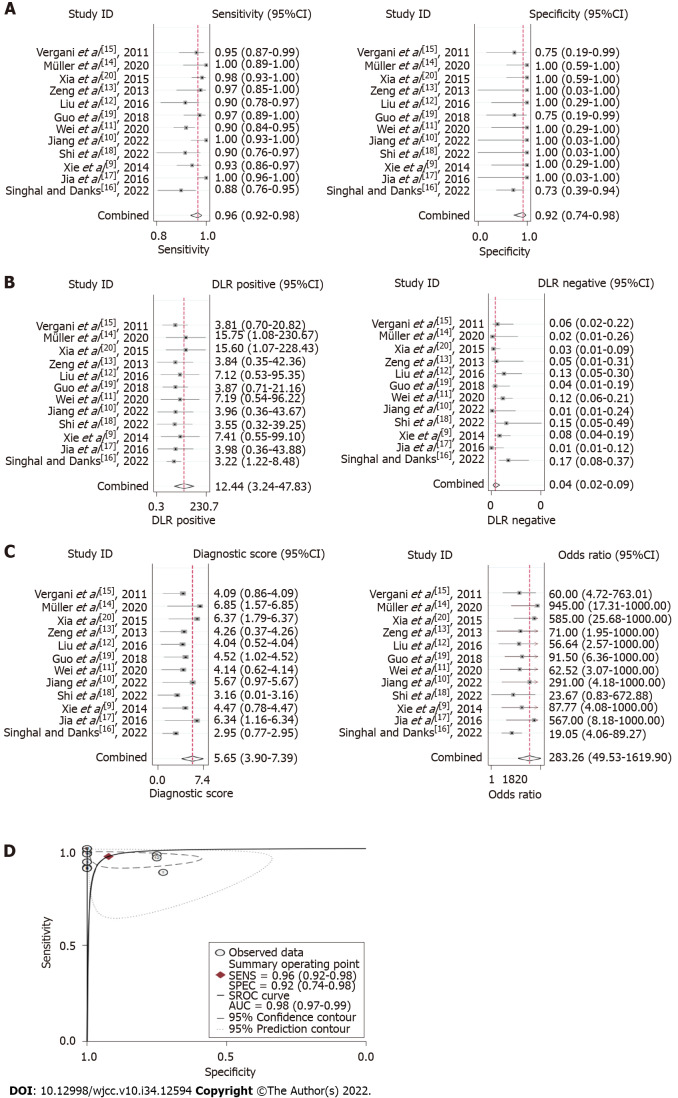
Figure 4.
Summary effect size of the meta-analysis. A: Pooled sensitivity and specificity; B: Pooled positive likelihood ratio and pooled negative likelihood ratio; C: Pooled diagnostic odds ratio; D: Summary receiver operating characteristic curve. CI: Confidence interval; AUC: Area under the curve.

