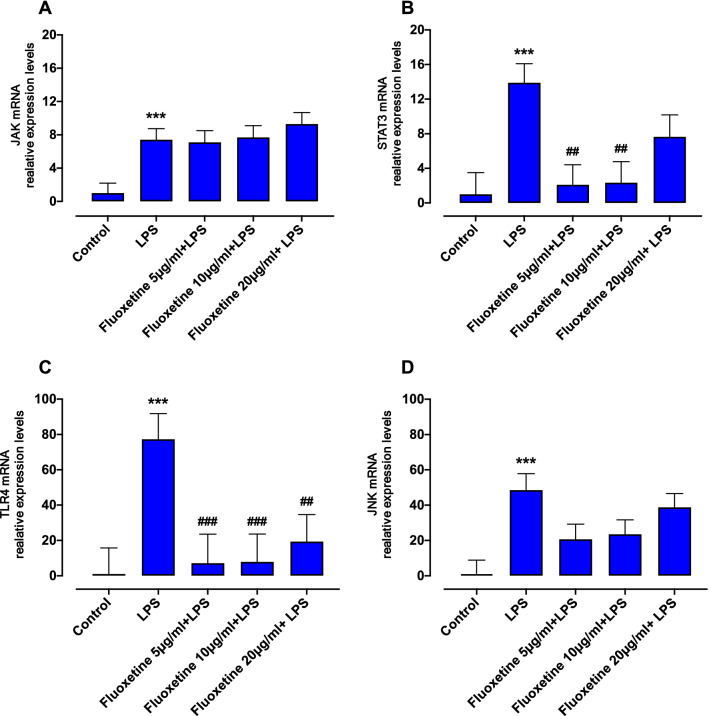
Fig. 4.
Effects of fluoxetine on expression levels of LPS-induced JAK (A), STAT3 (B), TLR4 (C) and JNK (D) in RAW264.7 macrophages. Cells were treated with LPS or LPS in combination with fluoxetine (5, 10 or 20 µg/ml) for 48 h. The mRNA expression data were normalized to the β-Actine signal and are presented as mean + SEM. All data are from three separate experiments in triplicate. ***p < 0.001 statistically significant compared with control, ###p < 0.001 and ##p < 0.01 compared with LPS alone

