Fig. 1.
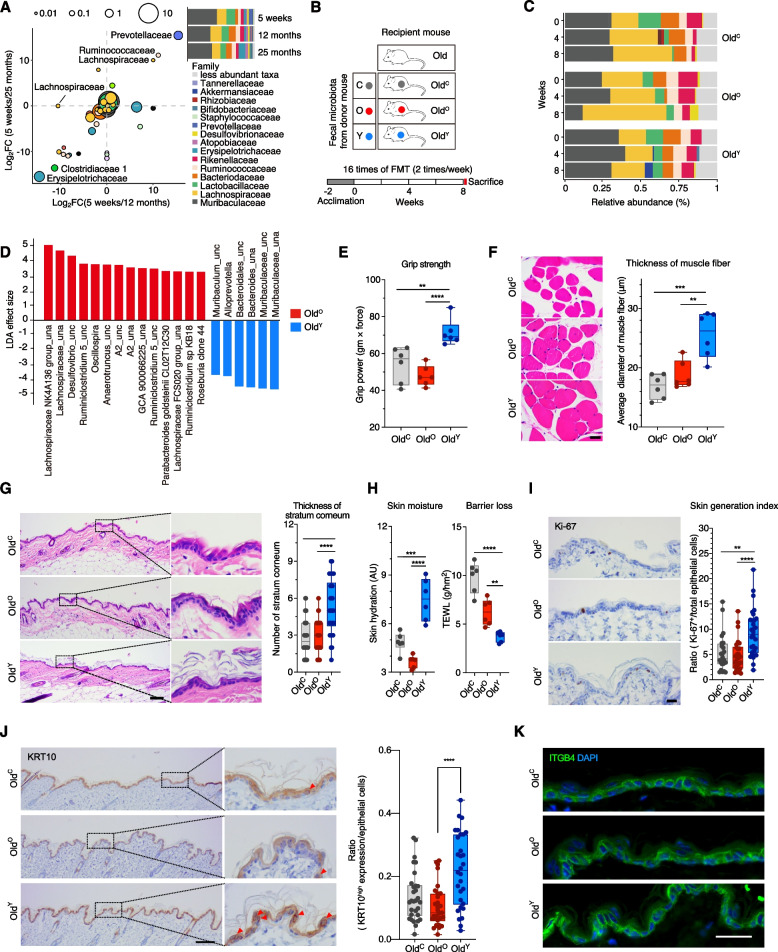
Fecal microbiota transplantation of young mice invigorates the fitness of old mice. A Relative abundance of gut microbiota at the family level in mice at 5 weeks (young, adolescence), 12 months (old, perimenopause), and 25 months (very old, senescence) of age. Scatter plot of the fold changes in the relative abundances of each species between the groups: 5 weeks against 12 months and 5 weeks against 25 months. Dot size indicates the mean proportion of each species. B Schematic illustration of fecal microbiota transplantation (FMT) to 12-month-old mice (Old). The matrix describes three donor groups: C, PBS with 10% glycerol for control; O, old at 12 months; Y, young at 5 weeks. The recipient mice are designated OldC (n = 6), OldO (n = 6) and OldY (n = 6), respectively. After 2 weeks of the acclimation period, FMT was performed 16 times for 8 weeks. Mice phenotypes were measured 3 days after the last FMT. C Relative abundance of the gut microbiota in Old during FMT. Samples were grouped by the fecal donor and ordered by collection time. D Linear discriminant analysis effect size of samples between OldO and OldY at week 8. _una, unassigned; _unc, uncultured. E Grip strength of contralateral forelimb for OldC, OldO, and OldY. F Hematoxylin and eosin (H&E) stain images of the hindlimb skeletal muscle fiber and average diameter of the muscle fiber in each group. Scale bar = 20 μm. G H&E stain images of the epidermal skin (left) and the average number of stratum corneum layers (right). Scale bar = 100 μm. H Skin hydration (left) and TEWL (right). I, J Immunohistochemical staining and quantification of Ki-67 (I) and KRT10 (J) in the epidermal skin layer. Scale bar = 100 μm. K Immunofluorescence staining of ITGB4. Scale bar = 25 μm. Box and whiskers. Student’s t test. *P < 0.05, **P < 0.01, ***P < 0.001, ****P < 0.0001

