Fig. 4.
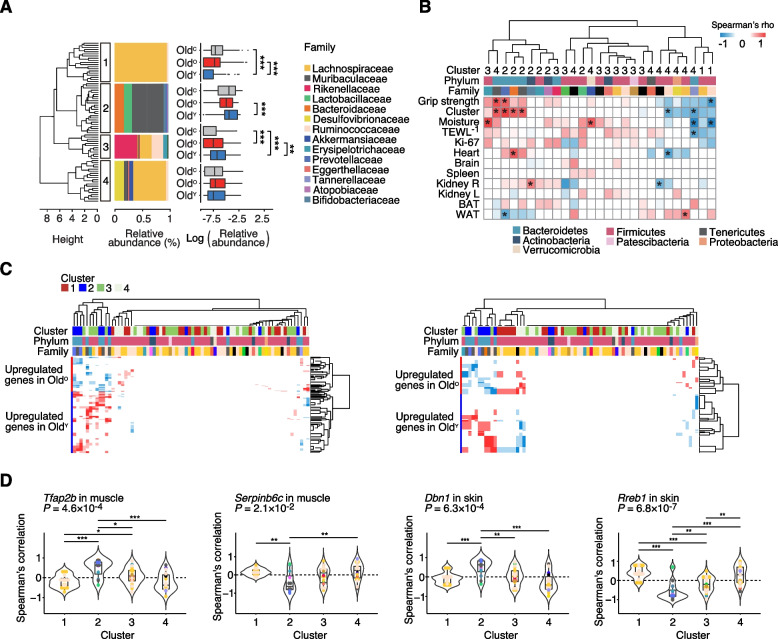
Correlation between co-occurring microbial clusters and host factors. A Gut microbiota of OldC, OldO, and OldY at week 8 was divided into four clusters by hierarchical clustering analysis with Spearman’s correlation coefficient. The dendrogram was generated by complete hierarchical clustering based on Euclidean distance and four clusters were determined by cutting off the tree at height 6. The taxon bar plot shows the microbial composition of each cluster at the family level, and the distribution of each cluster among the groups was displayed using a boxplot. B Heatmap of Spearman’s correlation between bacterial taxa and various phenotypes. C Heatmap of Spearman’s correlation between bacterial taxa and DEGs in the muscle (left) or skin (right). Only statistically significant correlations (P < 0.05) were plotted. D Violin plot representing Spearman’s correlation between microbial clusters and top FCs in the muscle and skin. Colored spots indicate the microbial families and horizontal lines in the box plot show the median. P values were calculated using the Kruskal-Wallis test. *P < 0.05, **P < 0.01, ***P < 0.001. Wilcoxon rank sum test.

