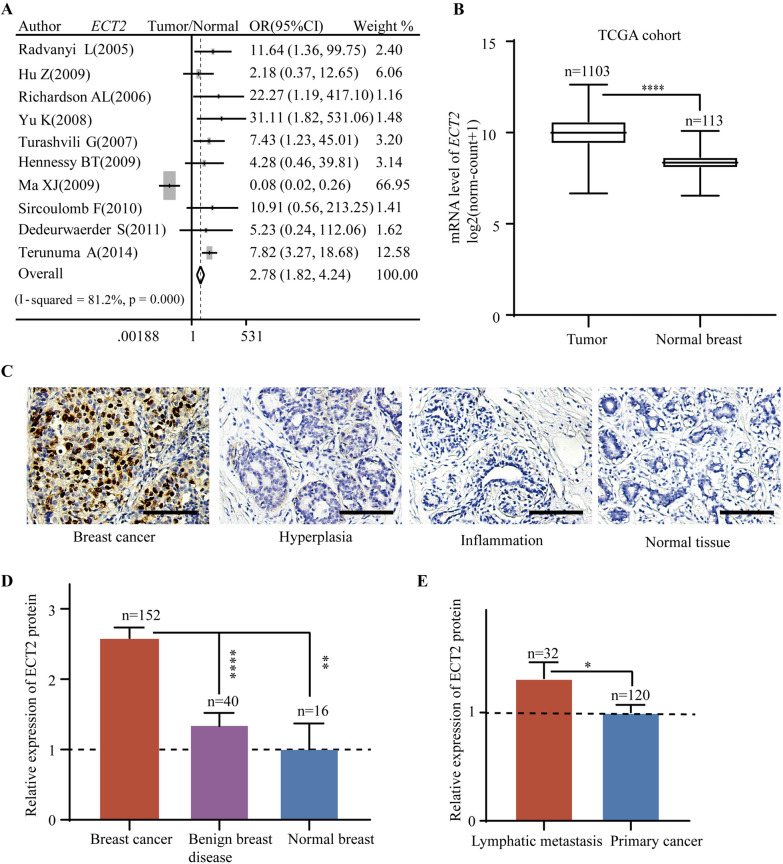
Fig. 1.
The expression level of ECT2 in breast cancer, benign disease, and normal breast tissues. A Pooled analysis of GEO datasets showing ECT2 mRNA level in breast cancer and normal tissues. B TCGA breast cancer dataset showing the level of ECT2 mRNA level in breast cancer and normal tissues. C The representative immunohistochemical staining images showing ECT2 protein expression in breast cancer and normal tissues. D Histogram showing ECT2 protein expression in breast cancer, benign disease, and normal breast tissues. E Histogram showing ECT2 protein expression in lymphatic metastasis and primary breast cancer tissues. Scale bar: 100 μm

