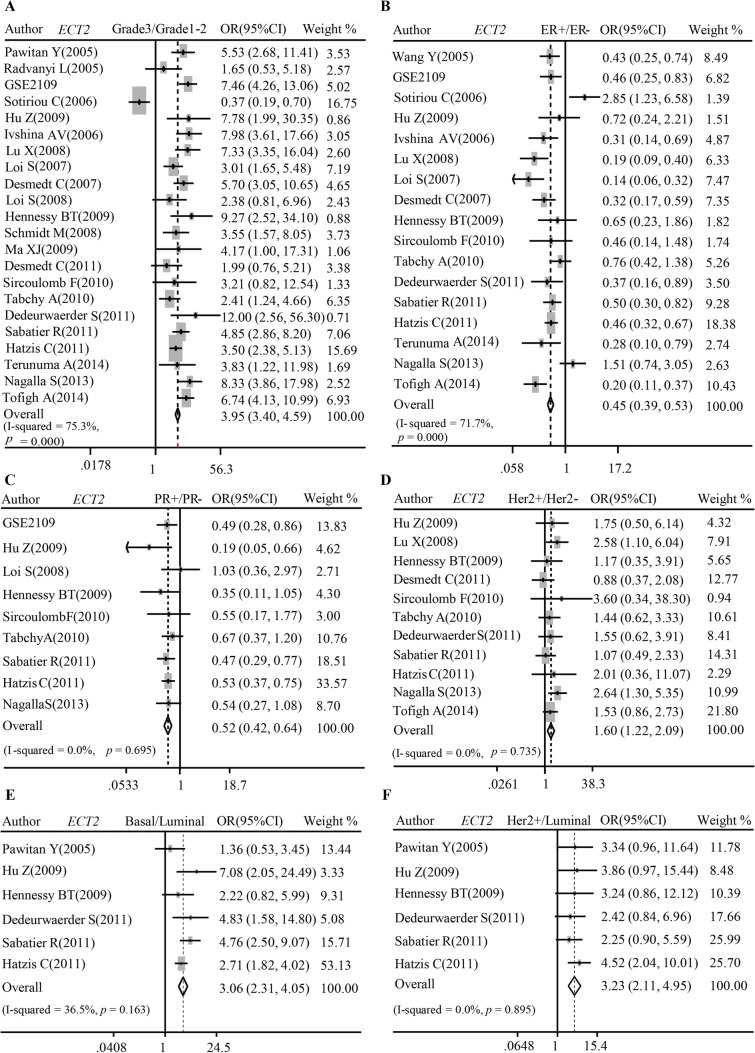
Fig. 3.
Pooled analysis showing the correlations between ECT2 mRNA and molecular biomarkers of breast cancer. A Pooled analysis showing the correlations between ECT2 mRNA level and differentiation grade. B Pooled analysis showing the correlations between ECT2 mRNA level and ER status. C Pooled analysis showing the correlations between ECT2 mRNA level and PR status. D Pooled analysis showing the correlations between ECT2 mRNA level and HER2 status. E, F Pooled analysis showing the correlations between ECT2 mRNA level and subtypes of breast cancers

