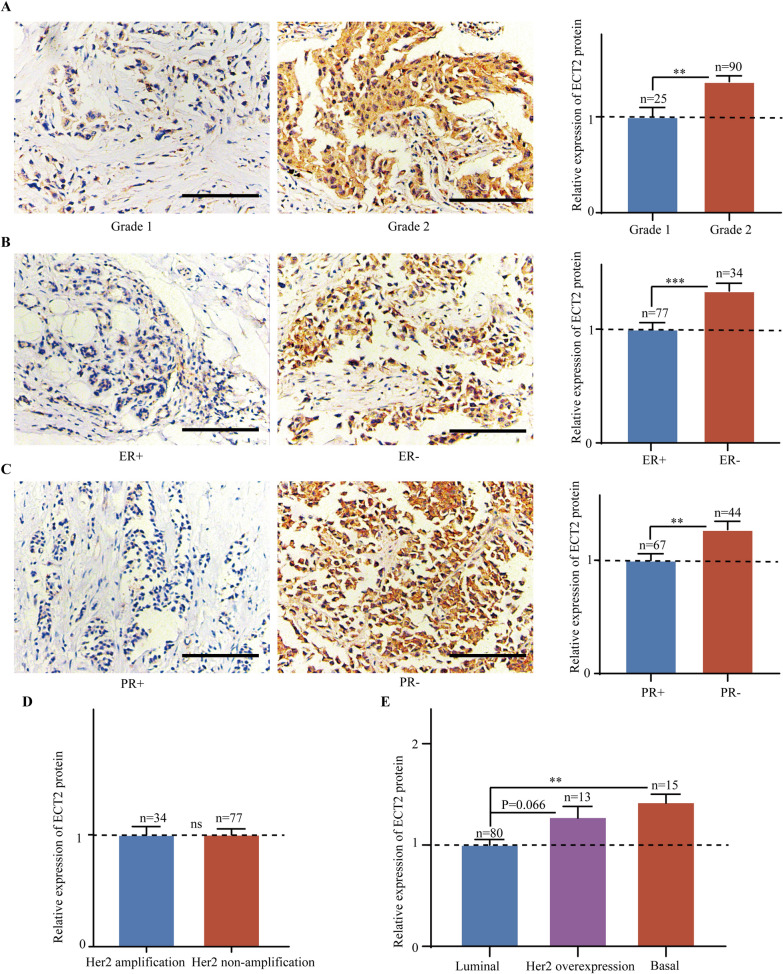
Fig. 4.
Data from tissue microarray showing the relationship between ECT2 protein level and molecular biomarkers of breast cancer. A The representative immunohistochemical staining images showing ECT2 protein expression in Grade 1 and Grade 2 breast cancers. B The representative immunohistochemical staining images showing ECT2 protein expression in ER+ and ER− breast cancers. C The representative immunohistochemical staining images showing ECT2 protein expression in PR+ and PR− breast cancers. D Histogram showing ECT2 protein expression in Her2-amplificated and non-amplificated breast cancers. E Histogram showing ECT2 protein expression in different subtypes of breast cancers. Scale bar: 100 μm

