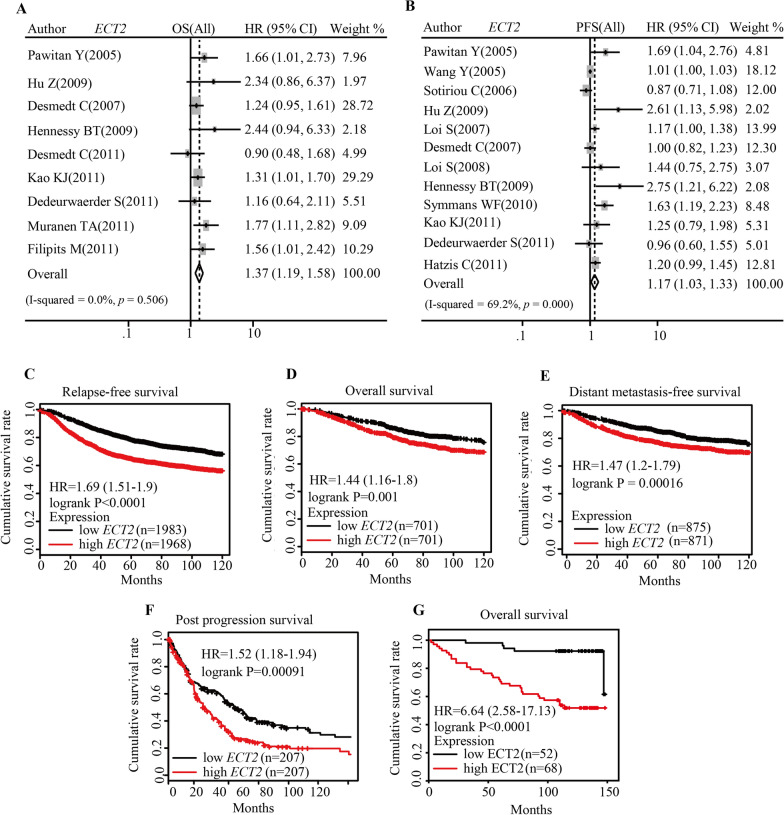
Fig. 7.
The predictive value of ECT2 for the prognosis of breast cancer patients. A Pooled analysis showing the relationship between ECT2 mRNA level and overall survival. B Pooled analysis showing the relationship between ECT2 mRNA level and progression-free survival. C Survival curves showing the relationship between ECT2 mRNA level and relapse-free survival (data from Kaplan–Meier plotter). D Survival curves showing the relationship between ECT2 mRNA level and overall survival (data from Kaplan–Meier plotter). E Survival curves showing the relationship between ECT2 mRNA level and distant metastasis-free survival (data from Kaplan–Meier plotter). F Survival curves showing the relationship between ECT2 mRNA level and post-progression survival (data from Kaplan–Meier plotter). G Survival curves showing the relationship between ECT2 protein level and overall survival (data from tissue microarray)

