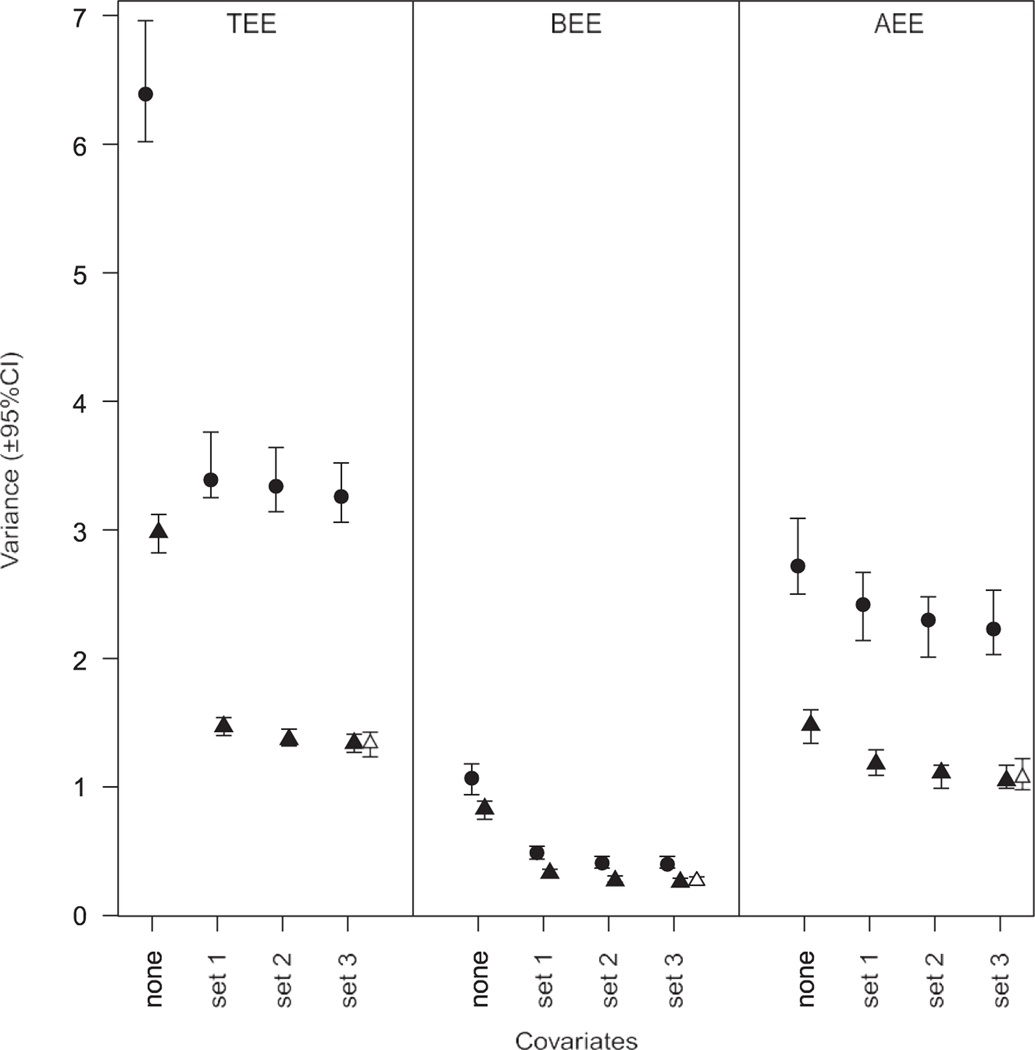
Figure 1.
Male (closed circles) and female (closed triangles) variance for A) total energy expenditure (TEE), B) basal energy expenditure (BEE), and C) activity energy expenditure (AEE). While within sex variance differs considerably between TEE, BEE, and AEE, in each case, male variance is greater than female variance. Values shown are the posterior modes with 95% highest posterior density credible intervals (CI) for the sex-specific residual variance estimates extracted from models that did not include covariates (‘none’), and models that included three sets of covariates such as height and fat-free mass (set 1), height, fat-free mass, fat mass, and age (set 2), and height, fat-free mass, fat mass, age, and sex-specific nonlinear age and body composition effects (set 3). The open symbols show the variance estimates in females obtained from an analysis restricted to a data set in which sample size was randomly reduced to equal that of males.

