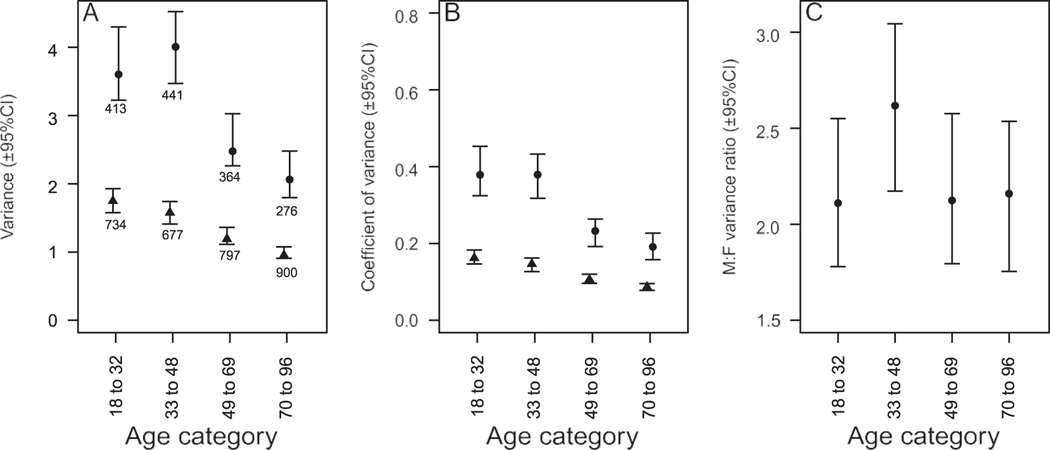
Figure 3.
Age-specific A) variance and B) coefficient of variance in total energy expenditure in males (circles) and females (triangles) and C) male:female variance ratio. The amount of greater male variability (GMV) remains fairly constant across age categories. Values shown are the posterior modes with 95% highest posterior density credible intervals (95% CIs) extracted from a single model that included multiple covariates and sex-specific nonlinear aging and body condition effects. Numbers shown below the symbols are the sample sizes for each category.

