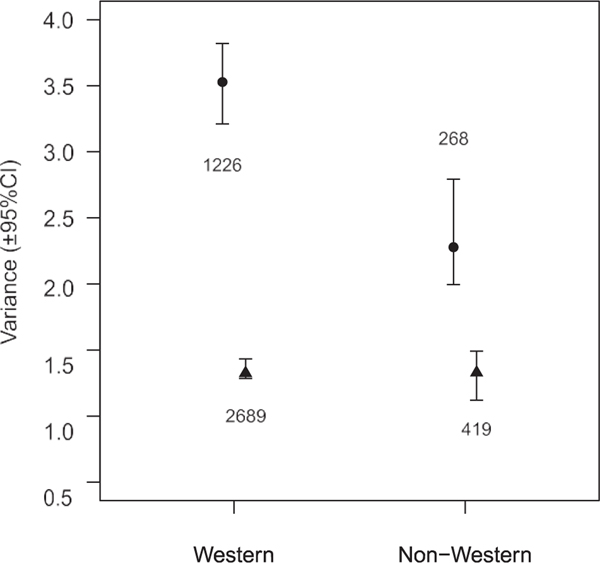
Figure 4.
Male (circles) and female (triangles) variance for total energy expenditure disaggregated into Western countries and non-Western countries. Values shown are the posterior modes with 95% highest posterior density credible intervals (CIs) for the sex-specific residual variance estimates extracted from models that included height, fat-free mass, fat mass, age, and sex-specific nonlinear age and body composition ef- fects, and country as a random factor. Numbers shown by the symbols are the sample sizes for each category. Variance in total energy expenditure among males is much higher in Western than non-Western countries, whereas the variance among females is similar in Western and non-Western countries; thus, the magnitude of greater male variability is decreased in non-Western countries.

