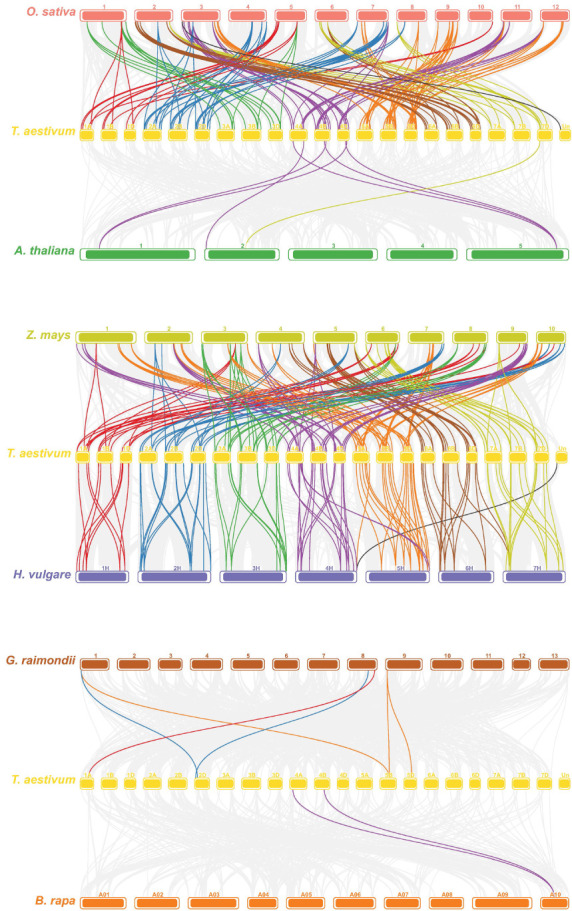
Figure 4.

Synteny analysis of PHD genes in wheat. All TaPHD genes were mapped to their respective locus in the wheat genome in a circular diagram using shinyCircos (Yu et al., 2018). Subgenomes are indicated by different shades of blue (outer track), and chromosomal segments are indicated by shades of gray (inner track). Homoeologous PHD genes were inferred by phylogeny (for details see the Materials and Methods section) and linked with chromosome-specific colors.
