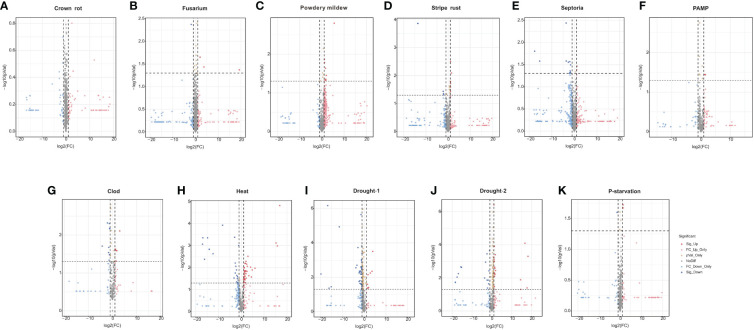
Figure 9.
Expression of TaPHDs during different biological stress. Volcano map of expression profiles for 244 TaPHD genes under different biological/abiotic stresses, including (A) crown rot infection, (B) Fusarium infection, (C) powdery mildew infection, (D) stripe rust infection, (E) Septoria (Septoria tritici infection and Zymoseptoria tritici infection), (F) PAMP (chitin and flg22 infection), (G) cold stress, (H) drought-1 (drought stress in Giza 168), (I) drought-2 (drought stress in Gemmiza 10), (J) heat stress, and (K) P-starvation. DEGs were defined as Fold Change > 1 and FDR < 0.05.

