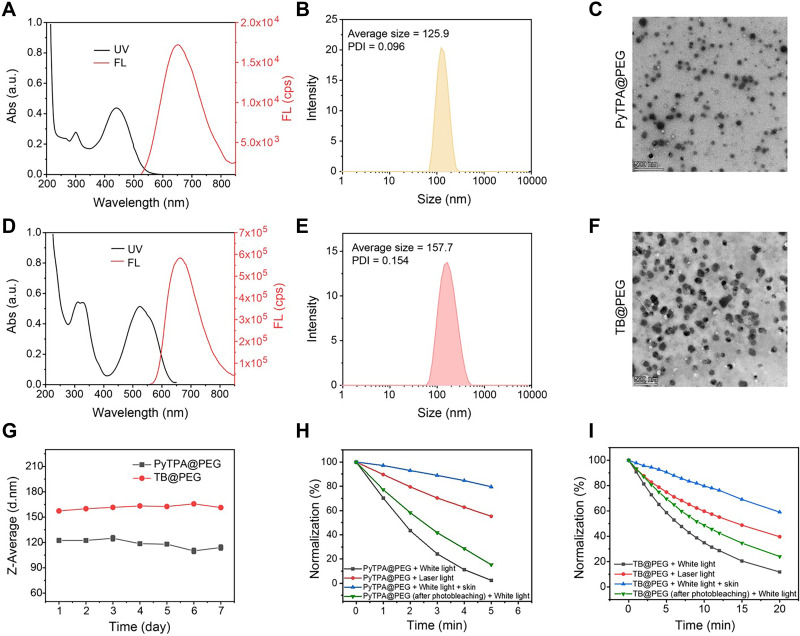
Figure 2.
Characterization of PyTPA@PEG and TB@PEG NPs. (A) UV-vis absorption and fluorescence spectra of PyTPA@PEG. The concentration of PyTPA@PEG is 10 μM (Ex = 450 nm). (B) Hydrodynamic size distribution of PyTPA@PEG. (C) TEM image of PyTPA@PEG. Scale bar: 500 nm. (D) UV-vis absorption and fluorescence spectra of TB@PEG. The concentration of TB@PEG is 10 μM (Ex = 530 nm). (E) Hydrodynamic size distribution of TB@PEG. (F) TEM image of PyTPA@PEG. Scale bar: 500 nm. (G) Stability assay of PyTPA@PEG and TB@PEG NPs in PBS solution at room temperature. (H) Photosensitivity of PyTPA@PEG upon light irradiation (white light, 80 mW cm−2, 532 nm laser light, 80 mW cm−2). The concentration of PyTPA@PEG is 5 μM. (I) Photosensitivity of TB@PEG upon light irradiation (white light, 80 mW cm−2, 532 nm laser light, 80 mW cm−2). The concentration of TB@PEG is 5 μM.

