Figure 4.
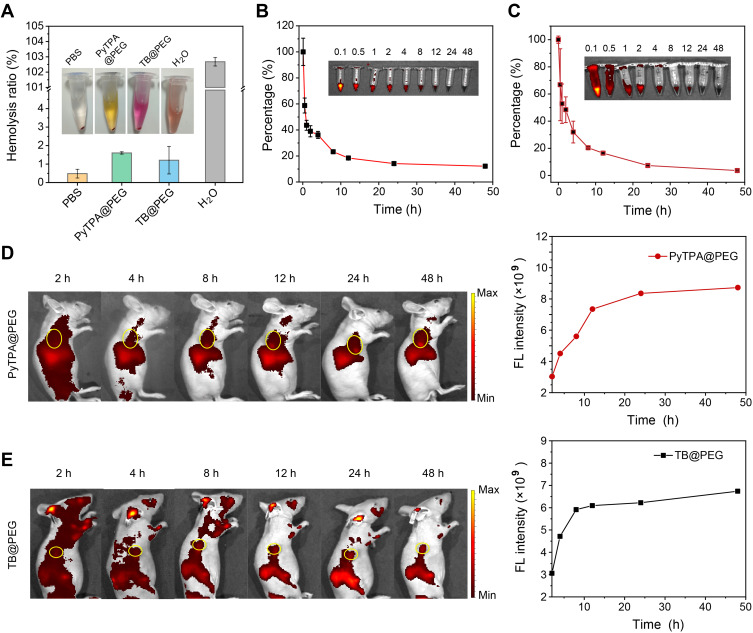
Circulation kinetics and bio-distribution of NPs. (A) Hemolysis test after incubated with PBS (negative control), PyTPA@PEG, TB@PEG, and ultrapure water (positive control). The results were presented as the mean ±SD (n = 3). (B) and (C) Relative fluorescence intensity of PyTPA@PEG (0.5 mg mL−1, 100 μL) and TB@PEG (0.5 mg mL−1, 100 μL) in the blood after injection via the tail vein and circulation profile in mice. The results were presented as the mean ± SD (n = 3). (D) and (E) Fluorescence images in vivo and fluorescence intensity of tumor of PyTPA@PEG and TB@PEG with different injection time after the tail vein injection. PyTPA @PEG: Ex = 465 nm, Em = 660 nm. TB@PEG: Ex = 535 nm, Em = 680 nm.

