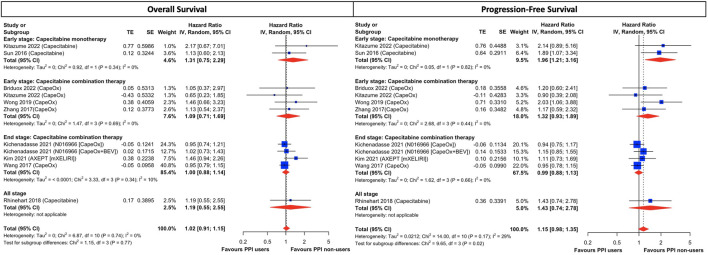
FIGURE 3.
Subgroup analysis of cancer stage and treatment combination in CRC patients treated with capecitabine-based regimens. The size of squares is proportional to the weight of each study. Horizontal lines indicate the 95% CI of each study; diamond, the pooled estimate with 95%. PPI, proton pump inhibitors; CI, confidential interval; CRC, colorectal cancers; CapeOx, capecitabine plus oxaliplatin; mXELIRI, capecitabine plus irinotecan; BEV, bevacizumab.

