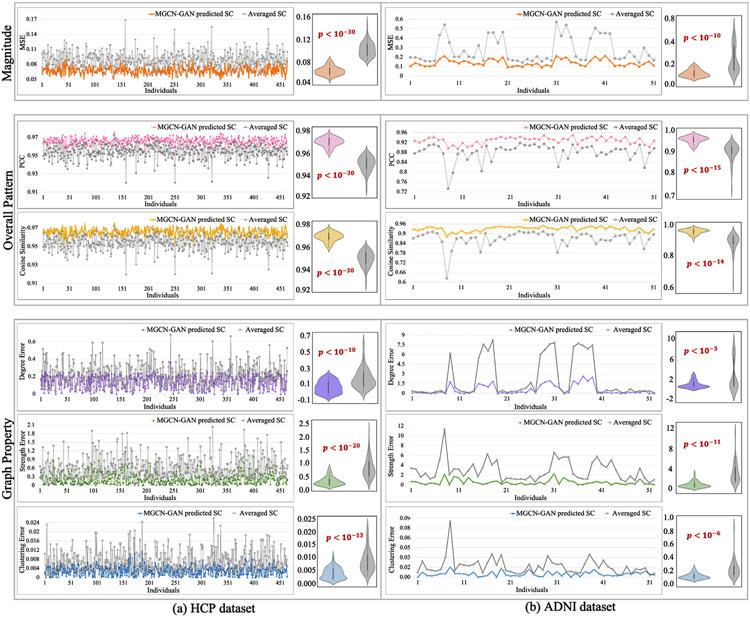
Fig. 7.
We quantitatively measured the similarity between the predicted SCs with real SCs (based on Desikan-Killiany atlas) from three perspectives (magnitude, overall pattern and network property) by using six measures (MSE, cosine similarity, PCC, mean degree, mean strength and mean clustering coefficient). We calculated two differences for each measure at individual level: one is the difference between our predicted SC and real SC, and the other is the difference between the population-averaged SC and the real SC. We showed the two sets of differences by line chart and displayed the distributions by violin plot. The significance analysis was also conducted with p-value calculated by one tail two sample T-test.

