
Fig. 6.
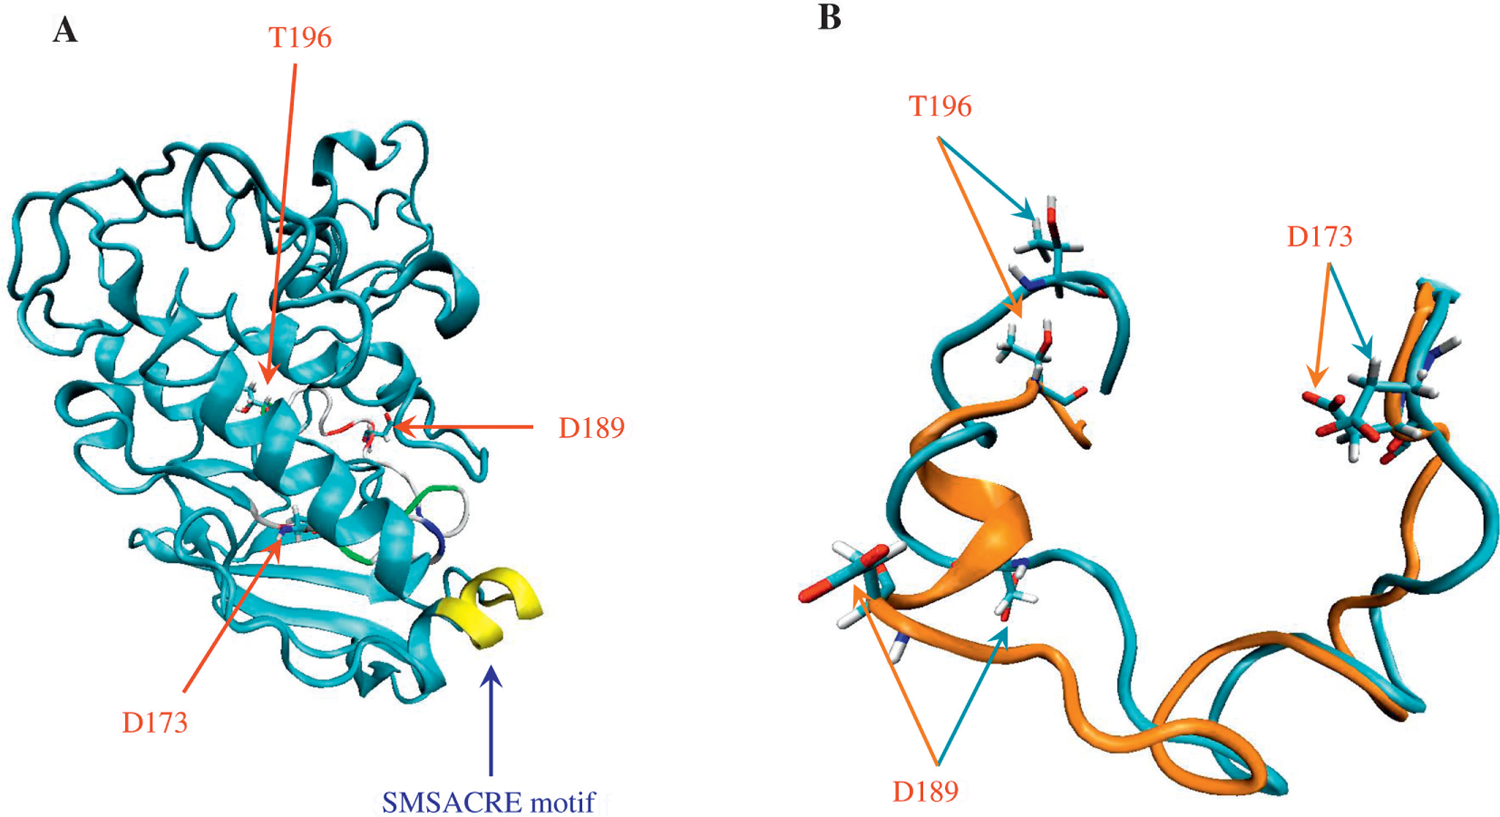
The hypothetical structure and the predicted activation loop of CDK8. A: the hypothetical structure of human CDK8 with the lowest energy from the molecular dynamics simulations. The molecular dynamics simulations revealed the heating phase to show a gradual increase in temperature with a few abrupt elevations; temperature at the equilibration phase was approximately 325 K, as expected. The energy profile (kinetic energy, potential energy, and total energy) was calculated. The kinetic energy was stable, as predicted by the stability of the temperature plot, which is directly proportional to the kinetic energy. The total and potential energy plots showed a gradual decrease, implying that the system had achieved an energy state more stable than the starting structure. The potential energy plot, which showed the structure with the lowest energy, was of greatest interest; its coordinates will be provided upon request. The backbone root-mean-square deviation (RMSD) plot, generated by using the lowest-energy structure as the reference, showed a decrease in RMSD during the simulation trajectory, indicating the equilibration steps are gradually approaching to the structure with the lowest energy. B: the models of human CDK8 activation loop. Cyan color represents the activation loop from the lowest potential energy structure (−7313 kcal/mol) during 50-ns simulation. Orange color represents the activation loop from the highest energy structure (−6677 kcal/mol) during 50-ns simulation. All the molecular dynamics simulation input, output and trajectory files are available upon request.