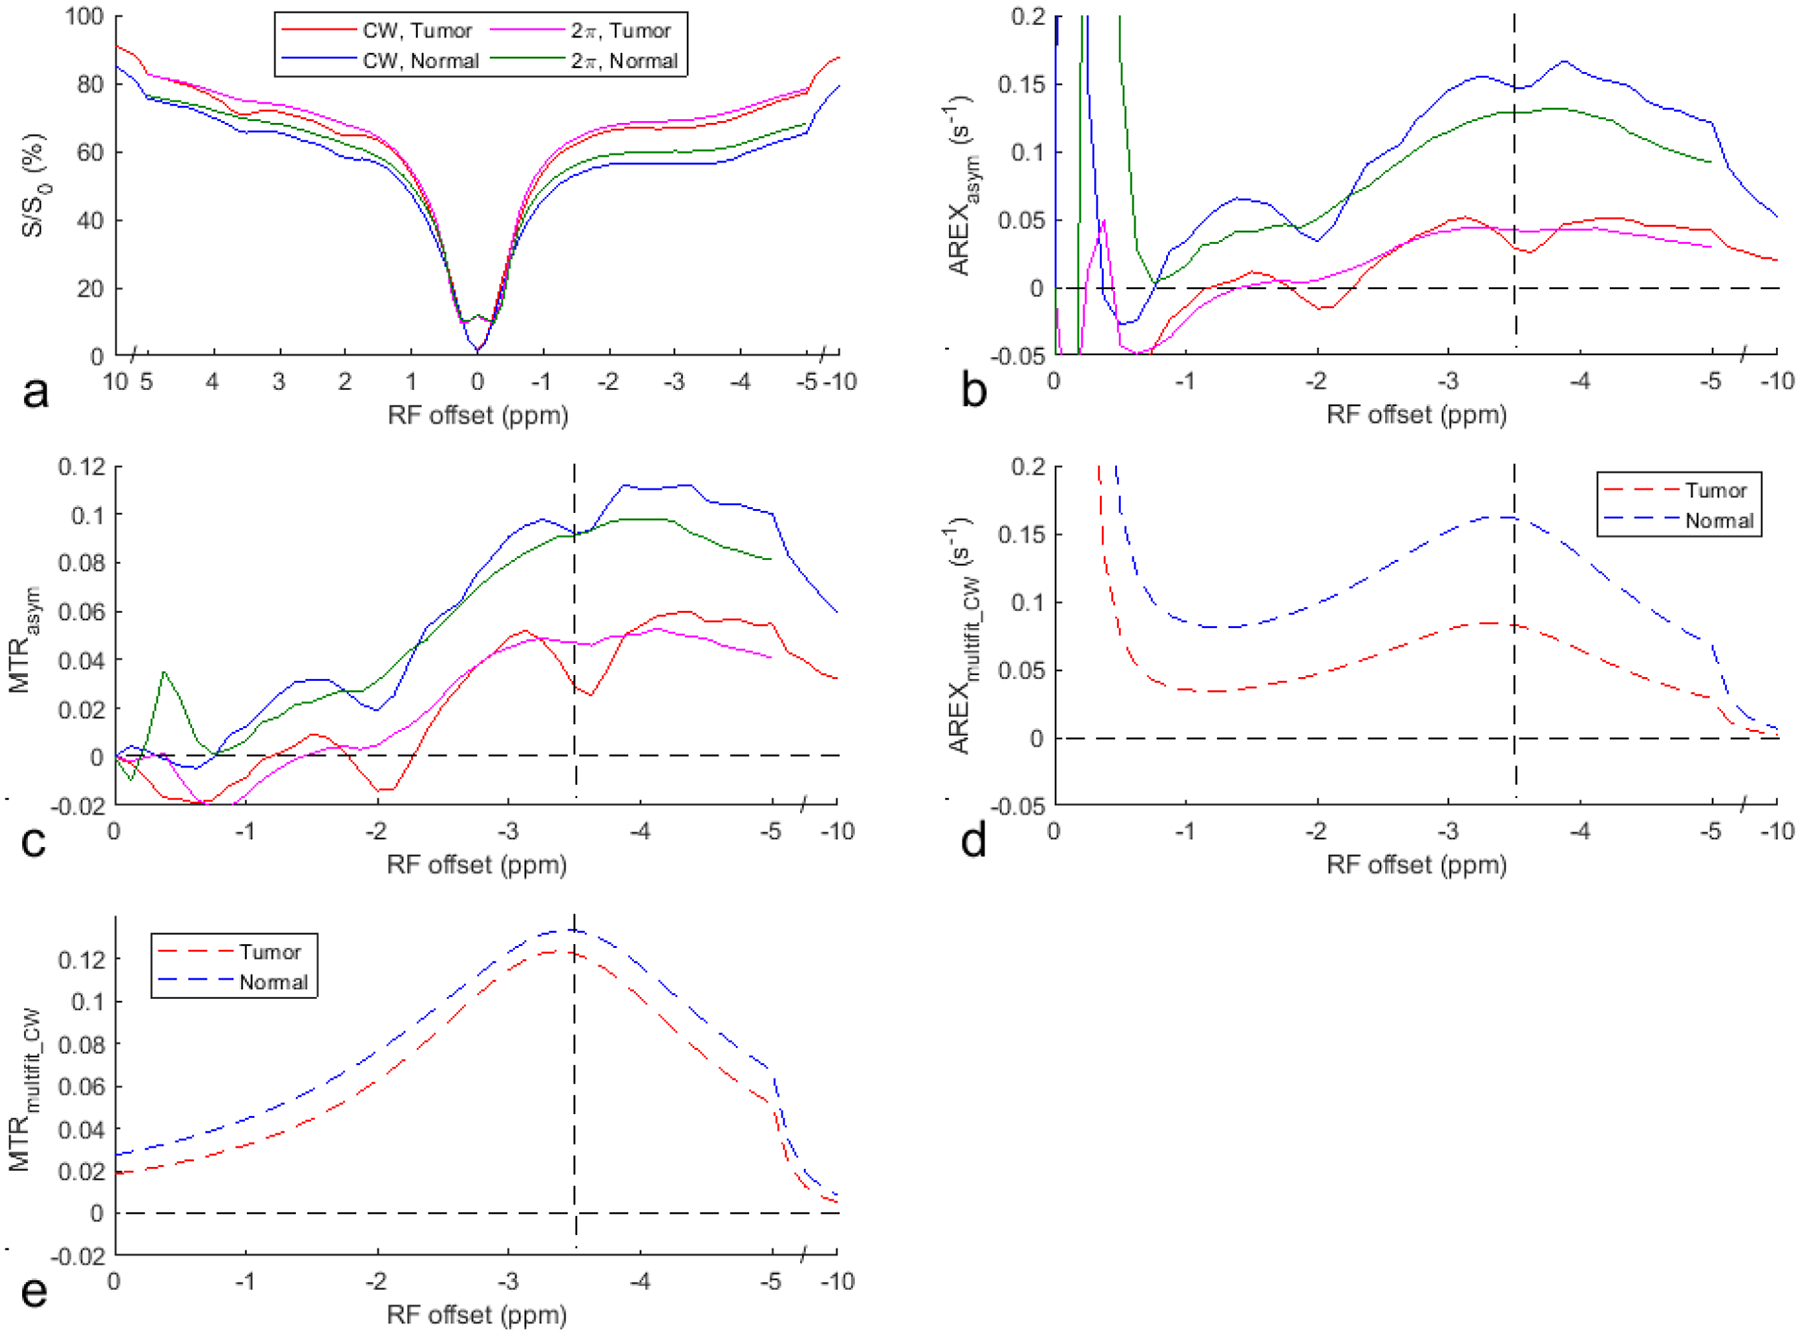
Fig. 4.

Average CW-CEST and 2π-CEST Z-spectra (a), AREXasym_CW and AREXasym_2pi spectra (b), MTRasym_CW and MTRasym_2pi spectra (c), AREXmultifit_CW spectra (d), and MTRmultifit_CW spectra (e) from the tumor and the contralateral normal tissue of three rat brains. The vertical dashed line in (b-e) indicates a Δω of −3.5 ppm. The horizontal dashed line in (b-e) indicates the AREXasym and MTRasym values of 0.
