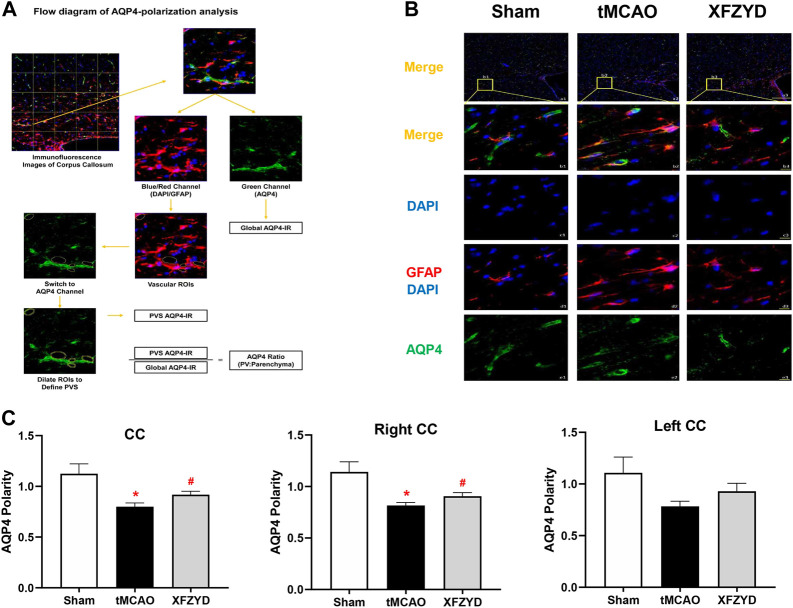
FIGURE 4.
XFZYD restored AQP4 depolarization after tMCAO. (A) Flow diagram of AQP4-polarization analysis. (B) Representative images of AQP4 polarity in the CC. (a1-a3) Representative images showing the polarization of AQP4, GFAP and DAPI in different groups (green, AQP4; red, GFAP; blue, DAPI; scale bar, 200 μm). (b1-b3) Enlarged views of a1-a3 (scale bar, 10 μm). (c1-c3) The same regions but showing DAPI (scale bar, 10 μm). (d1-d3) Same regions as for GFAP and DAPI but showing vascular ROIS (scale bar, 10 μm). (e1-e3) AQP4 channels (scale bar, 10 μm). (C) Quantitative analysis of AQP4 polarization in the whole CC, the left CC and right CC (* p < 0.05 vs. the sham group, # p < 0.05 vs. the tMCAO group; n = 15 in CC from six mice per group). CC, corpus callosum.

