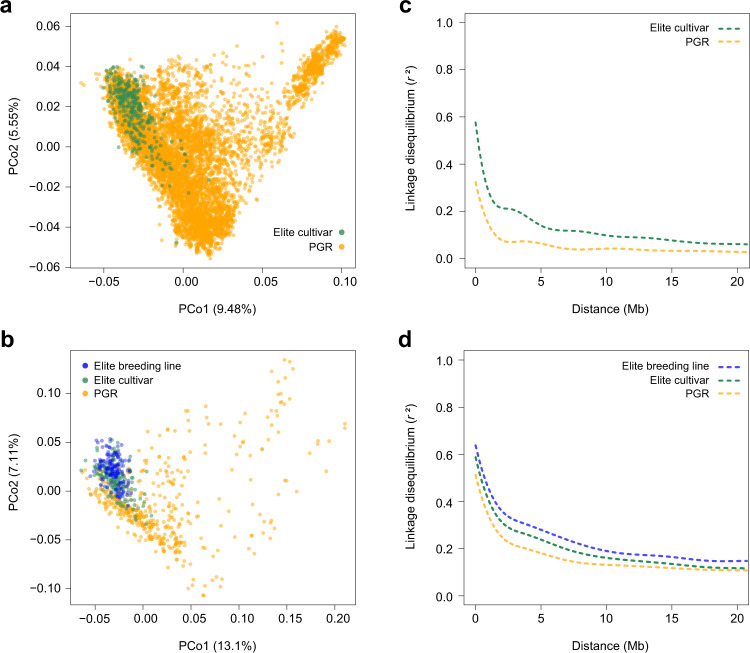
Fig. 3.
Molecular neutral diversity and linkage disequilibrium decay in genebank and elite plant material. Molecular diversity portrayed by the first two principal coordinates (PCos) from Rogers’ distance matrices calculated using genotyping-by-sequencing (GBS, (a)) and whole-genome sequencing (WGS, (b)). Intra-chromosomal linkage disequilibrium (r2) as a function of the genomic physical distance (Mb) in GBS (c) and WGS (d). GBS was conducted for 7,745 plant genetic resources (PGR) samples from the IPK genebank and 325 European elite cultivars. WGS was performed for 191 European elite cultivars, 131 German elite breeding lines and 446 PGR samples from the IPK genebank. Percentage of variation explained by PCos are included in brackets (). For r2 decay, distances between SNP pairs correspond to RefSeq v1.0 of Chinese Spring while cubic splines were fitted to whole genomes but only the first 20 Mb are portrayed.

