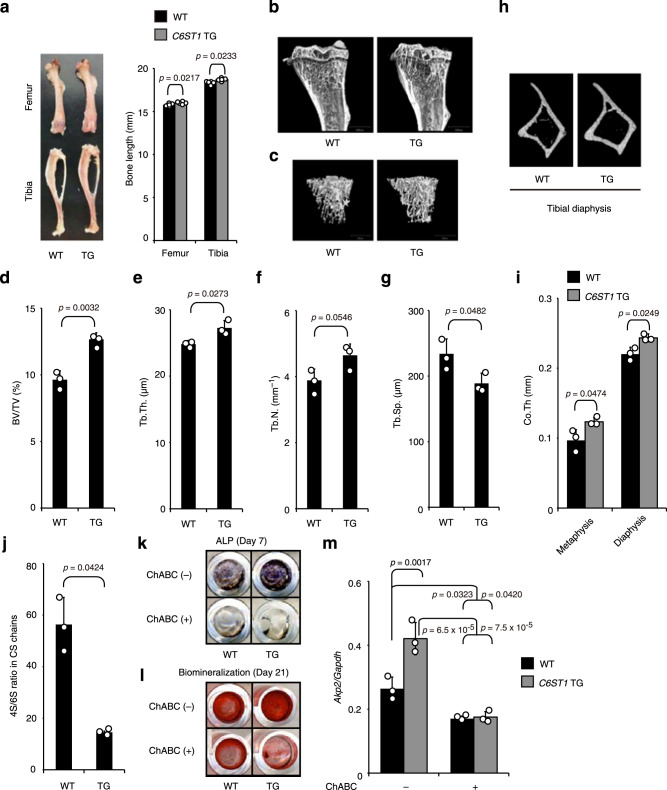
Fig. 5. High bone mass phenotypes in C6ST1 transgenic mice.
a The length of long bones (femurs and tibias) from 16-week-old wild-type (WT) or C6ST1 transgenic (TG) male mice (n = 5 bones from total, each from different litters, unpaired Student’s t-test, two-sided). b–i Micro-CT analysis of tibias from 16-week-old WT or C6ST1 TG male mice. b Medial, longitudinal section through a µCT-generated three-dimensional reconstruction of a tibia. c Micro-CT reconstruction of the trabecular region of tibial metaphysis. Micro-CT-based measurements of d trabecular bone volume to total volume (BV/TV), e trabecular thickness (Tb. Th.), f trabecular number (Tb. N.), and g trabecular separation (Tb. Sp.). d–g n = 3 bones from the total, each from different litters, unpaired Student’s t-test, two-sided). h Micro-CT reconstruction of the cortical region of the tibial diaphysis. i Micro-CT-based measurement of cortical thickness (Co. Th.). (n = 3 bones from total, each from different litters, unpaired Student’s t-test, two-sided). j–m Decreased 4S/6S ratio of CS chains promotes osteoblastogenesis. j The 4S/6S ratio of CS chains from WT or C6ST1 TG BMSCs (n = 3 cultures from 3 independent mice litters, for each genotype, unpaired Student’s t-test, two-sided). k–m Osteoblastic potential of BMSCs isolated from WT or C6ST1 TG male mice. BMSCs were maintained in a differentiation medium (DM) for 21 days in the absence (−) or presence (+) of ChABC. ALP staining (k) and Alizarin red staining (l) were performed on 7-day and 21-day cultures of BMSCs, respectively. Expression of Akp2 mRNA in 7-day cultures of BMSCs (m, n = 3 cultures from 3 independent mice litters, for each genotype, Tukey–Kramer multiple comparison method). Data in a, d–g, i, j, and m are represented as the mean ± s.d. Source data are provided as a Source Data file.

