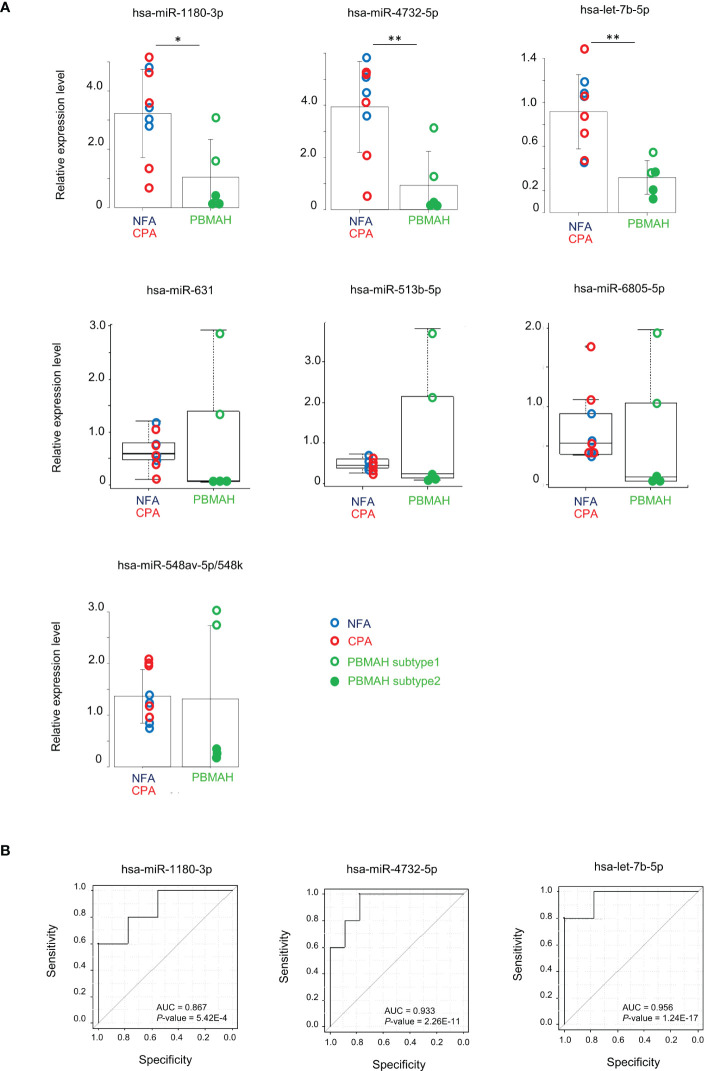
Figure 2.
Evaluation of miRNAs expression between adenoma (NFA and CPA) and PBMAH. (A) RT-qPCR analysis of hsa-miR-1180-3p, hsa-miR4732-5p, hsa-let-7b-5p, hsa-miR-631, hsa-miR513b-5p, hsa-miR6805-5p, and hsa-miR-548av-5p/548k. Data were normalized to hsa-miR16-5p and are shown with regard to the classification of adenomas including NFA (blue circle, n = 4), CPA (red circle, n = 5), and PBMAH (green circle, n = 5). Patients with PBMAH were divided into two subtypes based on hierarchical clusters. Subtype 1 (green open circles) includes sample numbers 11 and 14, and subtype 2 (green closed circles) includes sample numbers 10, 12, and 13. Student’s t-test or Mann-Whitney U test was used for the classification of adenoma versus PBMAH and bar plots with mean ± SD or box plots with the upper and lower quartiles and the median were shown for each analysis, respectively. *P <0.05, **P <0.01. (B) ROC curves for the prediction of PBMAH by hsa-miR-1180-3p, hsa-miR4732-5p, and hsa-let-7b-5p. Area under the curve (AUC) and P-values are also shown.

