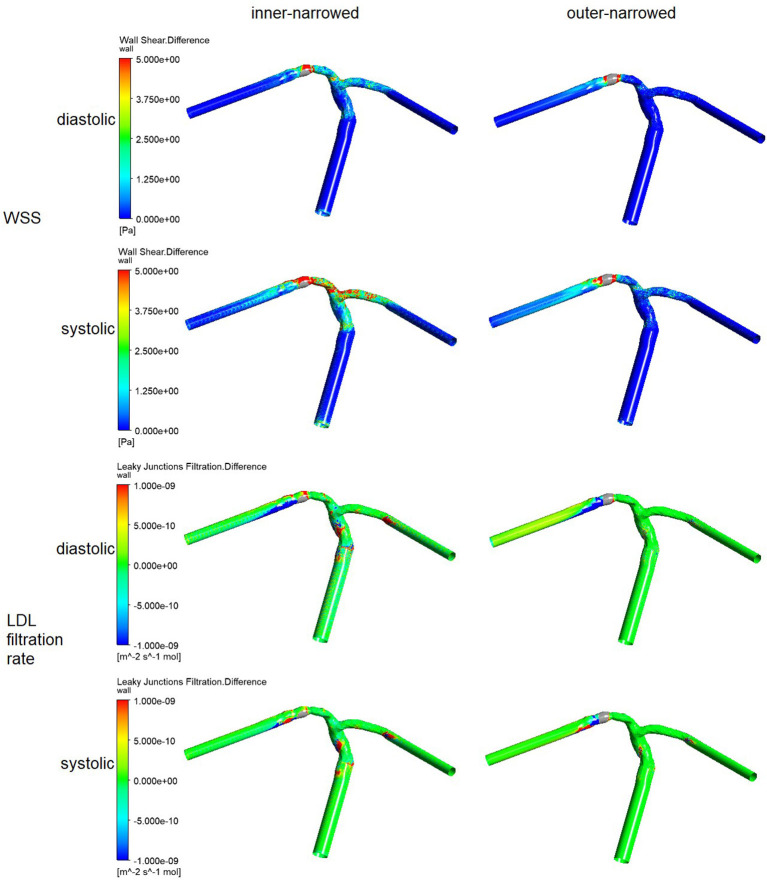
Figure 5.
The distribution of the differences in WSS and LDL filtration rate, of the inner-narrowed and outer-narrowed models compared with the enlarged model. The data were measured end-of-diastole and systole of the second cardiac cycle (0.86 s and 1.00 s in simulation) where the inlet blood pressure was minimal and maximal.

