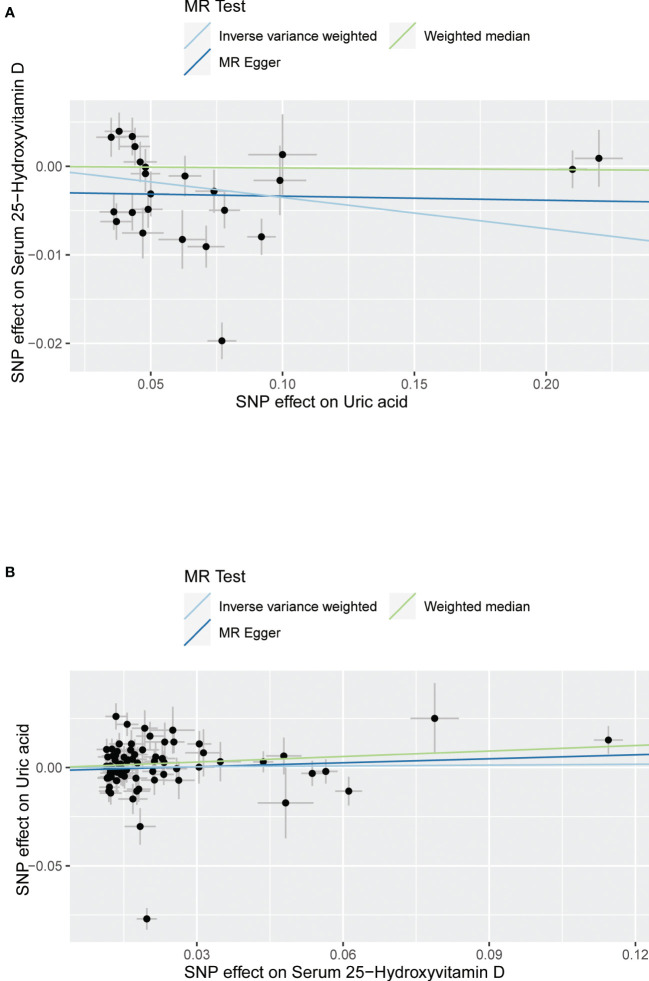
Figure 3.
Scatter plot showing the associations of the SNP effects between serum uric acid and 25-hydroxyvitamin D. Circles indicate genetic associations between serum uric acid and 25-hydroxyvitamin D. Error bars indicate 95% confidence intervals. (A) Serum uric acid on 25-hydroxyvitamin D; (B) 25-hydroxyvitamin D on serum uric acid. MR, Mendelian Randomization; SNP, single-nucleotide polymorphism.

