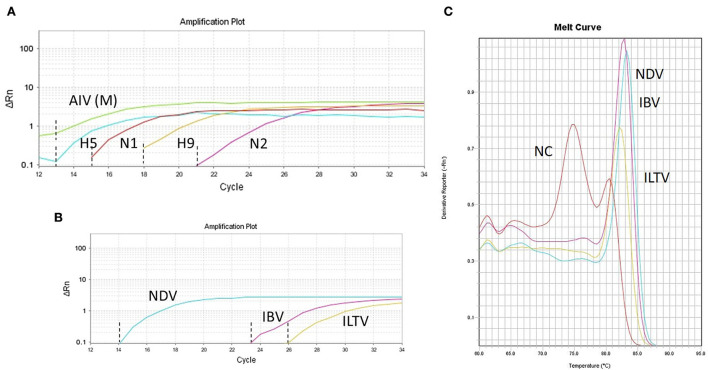
Figure 1.
RT-qPCRs amplification plots for specific target viral pathogens. (A) Simultaneous detection of generic avian influenza virus (AIV-M) and subtyping of AIV (H5, H9, N1, and N2) in a single run. (B) Simultaneous detection of Newcastle disease virus (ND), infectious bronchitis virus (IBV), and infectious laryngotracheitis virus (ILT) along with the melt curve (C) in a single run. NC denotes a negative control that shows a melt curve at a different temperature (~75°C). The Ct values of individual gene is indicated by dash lines (A,B) generated from the number of cycles.

