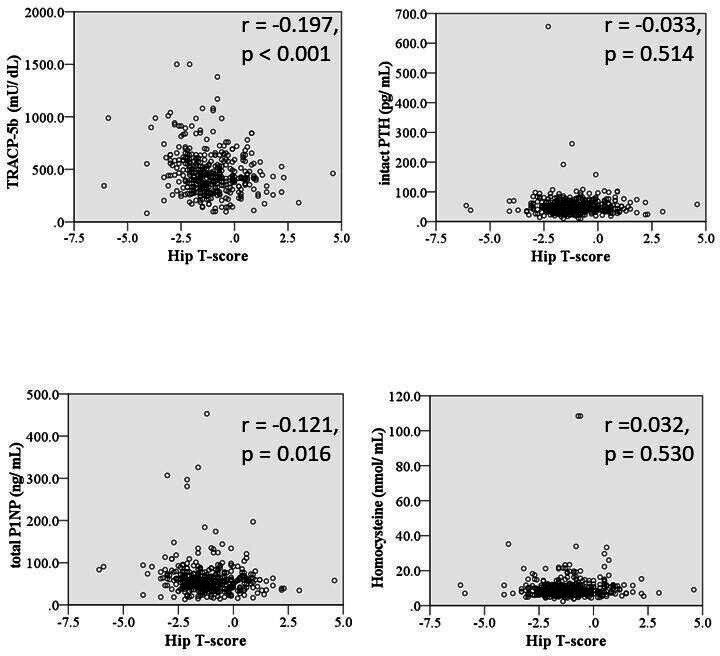
Fig. 6.

Scatter diagrams showing the relationships between hip T-scores and osteoporosis-related biomarkers (tartrate-resistant acid phosphatase 5b (TRACP-5b), total procollagen type 1 amino-terminal propeptide (total P1NP), intact parathyroid hormone (PTH), and homocysteine). The total number of patients was 398. All p-values were calculated using Pearson’s rank correlation. r = correlation coefficient.
