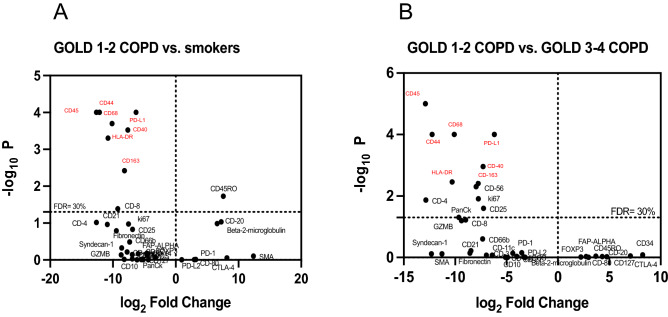
Figure 2.
Top protein targets identified with spatial profiling: Volcano Plot showing the proteins above a false discovery rate of 30% in peripheral lungs (across all the regions of interest) of smokers without COPD versus GOLD 1–2 COPD (A) and GOLD 1–2 COPD versus GOLD 3–4 COPD (B). The x-axis is the log2 fold change, whereas the y-axis is the log10 of the p-value. In red, the most significantly up-regulated proteins in GOLD 1–2 COPD patients versus smokers (A) and GOLD 3–4 COPD (B).

