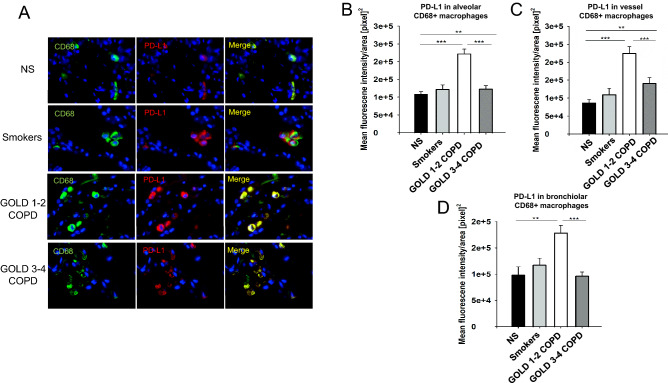
Figure 4.
PD-L1 is overexpressed in peripheral lung AMs from GOLD 1–2 COPD patients: Immunofluorescence analysis of PD-L1 expression in CD68+ AMs in peripheral lungs from Cohort 1. (A) representative immunofluorescence pictures showing CD68+ (green, as a marker of macrophages) and PD-L1+ (red) cells. Nuclear DNA was labeled with DAPI (blue). (B) Mean fluorescence intensity of PD-L1 in alveoli from never-smokers (NS), smokers without COPD, GOLD 1–2 and 3–4 COPD patients. (C) mean fluorescence intensity of PD-L1 in vessels from never-smokers (NS), smokers without COPD, GOLD 1–2 and 3–4 COPD patients. (D) Mean fluorescence intensity of PD-L1 in bronchioles from never-smokers (NS), smokers without COPD, GOLD 1–2 and 3–4 COPD patients. *P < 0.05, **P < 0.01, ***P < 0.001.

