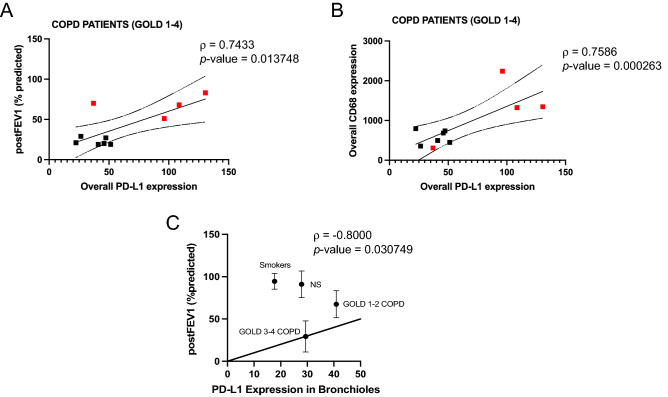
Figure 5.
PD-L1 expression directly correlates with lung function and with CD68 expression: Correlation between total spatial PD-L1 expression levels and post-FEV1 (% predicted) (A) and spatial PD-L1 and CD68 expression levels (B) across all the COPD patients. Results were shown as means ± SEM. Red squares indicate GOLD 1–2 COPD patients. (C) the correlation between spatial PD-L1 expression and post-FEV1 (% predicted) in bronchioles across all the subjects’ groups is shown. The statistical tests used in these analyses was Spearman correlation test considering 95% confidence interval.

