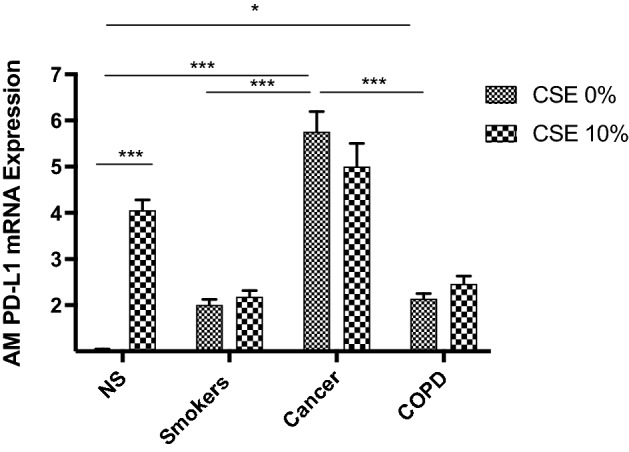
Figure 8.

Analysis of PD-L1 mRNA expression levels in AMs from human BAL before and after 10% CSE at 24 h. AMs from BAL all groups were treated with CSE at 10% for 24 h and the expression of PD-L1 mRNA was assessed by real-time RT-PCR. PD-L1 mRNA expression is shown as fold change with respect to 0% CSE. Results were shown as means ± SEM. The statistical tests used in these analyses were one-way analysis of variance followed by Bonferroni's post-test. *P < 0.05, **P < 0.01, ***P < 0.001, ****P < 0.0001. NS = Never smokers without cancer or COPD. CSE = cigarette smoke extract.
