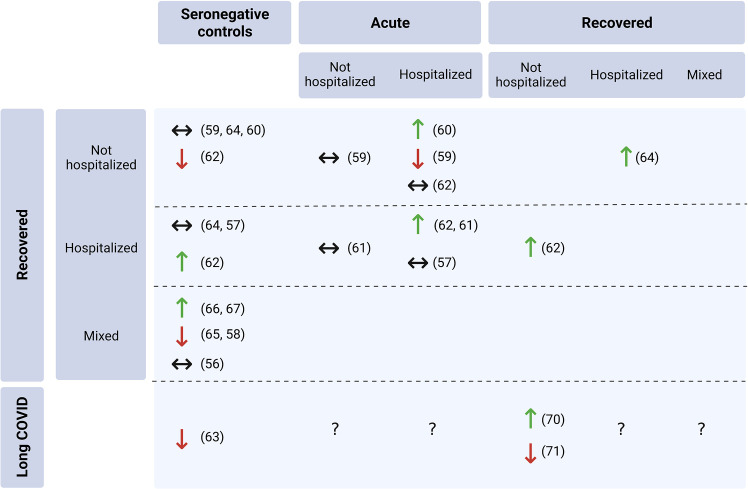
Figure 3.
Total Treg frequency in convalescent COVID-19 patients compared to other cohorts (references in brackets). The upwards arrow (↑) indicates a significant increase at p<0.05, the downwards arrow (↓) a significant decrease at p<0.05 and the left-right arrow (↔) not significantly different relative Treg proportions in convalescent patients (created with BioRender.com).

