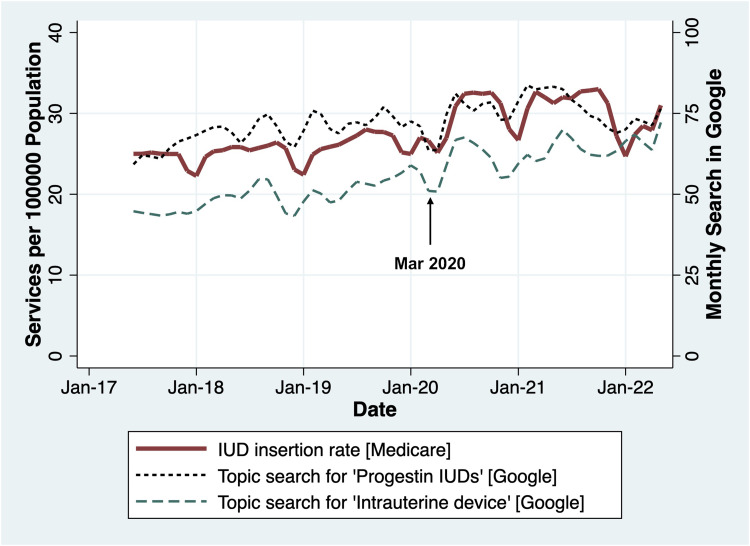
Figure 3.
Monthly per capita Medicare service utilization rates per 100,000 population for IUD insertion versus search volumes in Google for ‘Intrauterine device’ and ‘Progestin IUDs’ topics, June 2017 to May 2022 [LOWESS-smoothed] (March 2020 is marked because it was the month in which the Australian Government introduced national COVID-19-related lockdowns for the first time).

